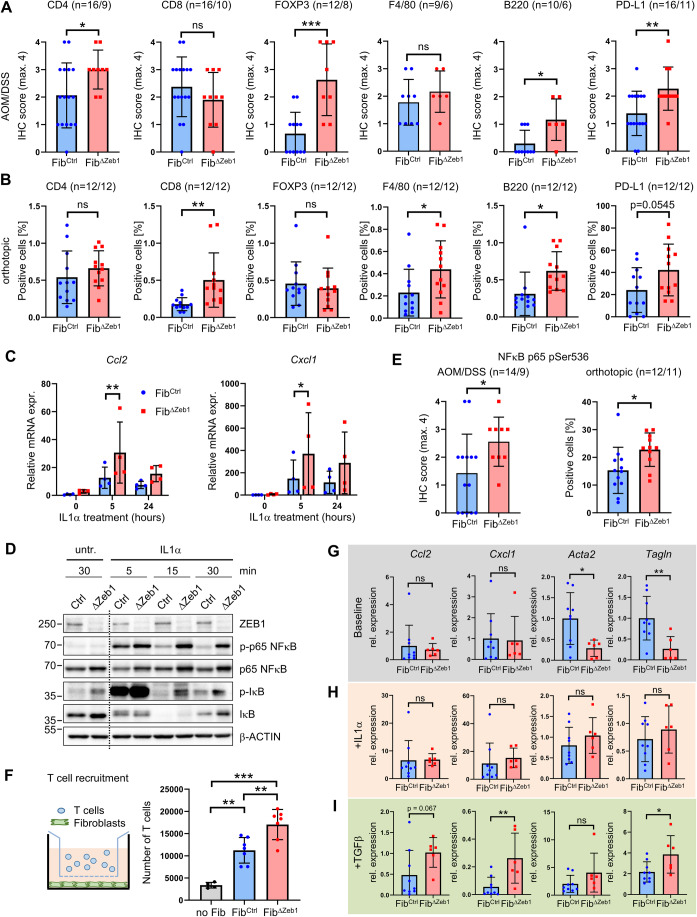
Figure 4. ZEB1 attenuates inflammatory signaling in fibroblasts and limits immune cell infiltration in multiple CRC models.
(A, B) IHC-based quantification of immune cell infiltration and PD-L1 expression in tumors from FibCtrl and FibΔZeb1 mice in the AOM/DSS model (A) and after orthotopic transplantation of AKP tumor organoids (B). Number of experimental mice per genotype are indicated (CD4, CD8, FOXP3, F4/80, B220, PD-L1: P = 0.0414, 0.2745, 0.0005, 0.3751, 0.0134, 0.0082 (AOM/DSS), P = 0.3383, 0.0068, 0.5852, 0.0401, 0.0122, 0.0545 (orthotopic), Student’s t test). (C) qRT-PCR analysis of Cxcl1 and Ccl2 mRNA expression in fibroblasts after in vitro recombination of Zeb1 and stimulation with IL1α (n = 4, two independent fibroblast lines per genotype in two biological replicates, 0, 5, 24 h: P = 0.9248, 0.0070, 0.1816 (Ccl2), P = 0.9998, 0.0337, 0.0890 (Cxcl1), Šídák’s multiple comparisons test). (D) Western blot of NFκB pathway activity in fibroblasts after 15 min of IL1α stimulation. β-ACTIN detection was used as a loading control. (E) IHC-based quantification of phospho-NFκB p65 (Ser536) in mice after AOM/DSS tumorigenesis or transplantation of AKPre organoids. Numbers of experimental mice per genotype are indicated (AOM/DSS: P = 0.0435, orthotopic: P = 0.0238, Student’s t test). (F) Quantification of T-cell attraction to fibroblasts after in vitro recombination of Zeb1 (n = 7 independent lines, no Fib vs FibCtrl: P = 0.0014, no Fib vs FibΔZeb1: P < 0.0001, FibCtrl vs FibΔZeb1: P = 0.0043, Tukey’s multiple comparisons test). (G–I) FibCtrl and FibΔZeb1 fibroblasts were seeded in 3D ECM and expression of fibroblast subtype markers was quantified by qRT-PCR. Baseline marker expression of FibCtrl and FibΔZeb1 fibroblasts without additional treatment (G) and after treatment with IL1α (H) or TGFβ (I) relative to the respective untreated condition (n = 9/6 for FibCtrl/FibΔZeb1 fibroblast lines, Ccl2, Cxcl1, Acta2, Tagln: P = 0.6830, 0.8861, 0.0184, 0.0084 (baseline), P = 0.9318, 0.5463, 0.3182, 0.7161 ( + IL1α), P = 0.0670, 0.0077, 0.1469, 0.0346 ( + TGFβ), Student’s t test). Data information: Data are presented as mean ± SD (A–C, E–I). Source data are available online for this figure.

