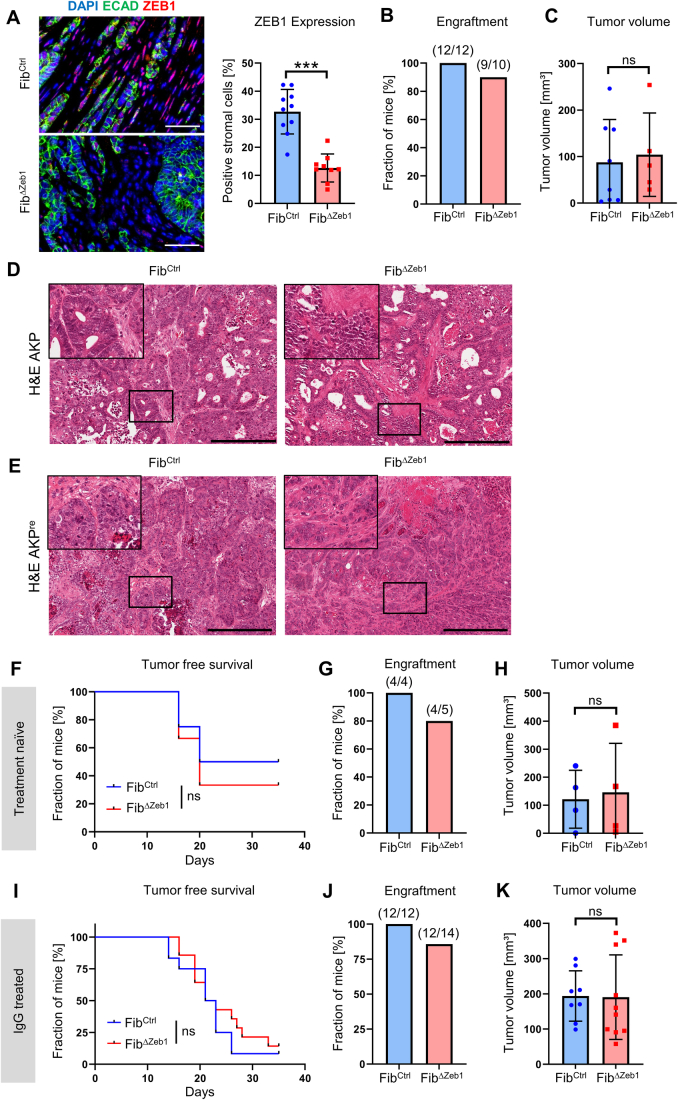
Figure EV1. Loss of Zeb1 in fibroblasts does not affect morphology of primary tumors in the orthotopic transplantation model.
(A) IF images and quantification of ZEB1 expression in tumor stroma after orthotopic transplantation of AKP tumor organoids (n = 10/9 independent mice for FibCtrl/FibΔZeb1, P < 0.0001, Student’s t test). (B) Quantification of primary tumor engraftment in treatment-naïve FibCtrl and FibΔZeb1 mice after orthotopic transplantation of AKP tumor organoids. Numbers of experimental mice are indicated. (C) Tumor volume after orthotopic transplantation of AKP tumor organoids (n = 8/5 independent mice for FibCtrl/FibΔZeb1, P = 0.7584, Student’s t test). (D, E) Representative H&E stainings of AKP (D) and AKPre (E) tumor sections. Top left corners show higher magnification of the indicated regions. (F–H) Analysis of tumors after orthotopic transplantation of AKPre tumor organoids in treatment-naïve FibCtrl and FibΔZeb1 mice. (F) Tumor onset (n = 4/5 for FibCtrl/FibΔZeb1; P = 0.6401, Mantel–Cox test). (G) Quantification of tumor engraftment. Numbers of experimental mice are indicated. (H) Tumor volume (n = 4/4 independent mice for FibCtrl/FibΔZeb1). (I–K) Analysis of tumors after orthotopic transplantation of AKPre tumor organoids in control IgG-treated FibCtrl and FibΔZeb1 mice. These mice are shown again as controls in Fig. 5. (I, J) Tumor onset (I) and quantification (J) after orthotopic transplantation of AKPre tumor organoids (n = 12/14 for FibCtrl/FibΔZeb1, P = 0.4564, Mantel–Cox test). (K) Tumor volumes (n = 8/10 independent mice for FibCtrl/FibΔZeb1). Only tumors collected after day 28 were included. Data information: Data are represented as mean ± SD (A, C, H, K). Scale bars represent 50 µm (A) or 1 mm (D, E). Source data are available online for this figure.

