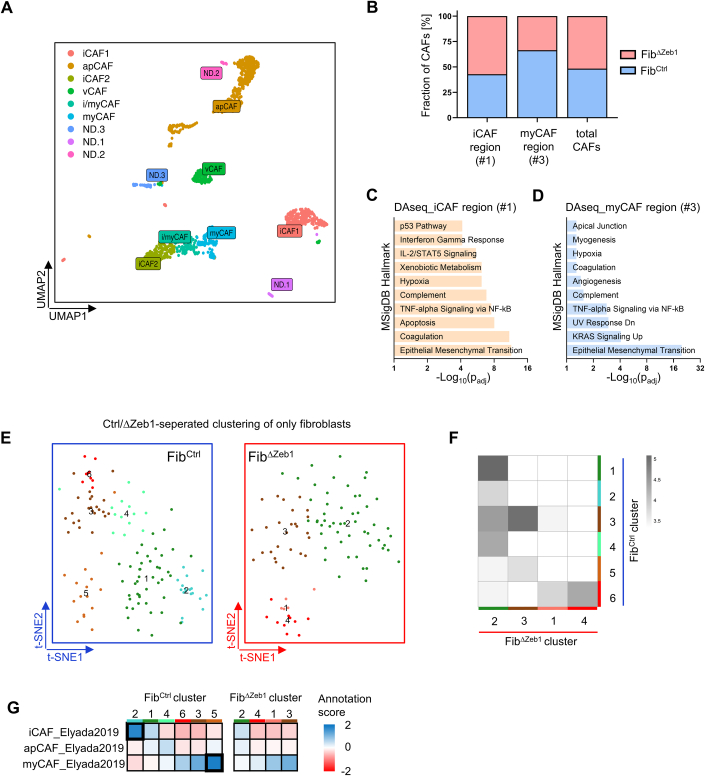
Figure EV2. scRNA-seq in AOM/DSS and orthotopic models show reduced CAF diversity and impaired subtype-specific gene expression in FibΔZeb1 tumors.
(A) Phenotypic annotation of AOM/DSS CAFs (n = 3 mice per genotype; corresponding to Fig. 2) upon integrated clustering by scoring of iCAF/myCAF/apCAF/mCAF/vCAF gene signatures (Bartoschek et al, 2018; Elyada et al, 2019) and displayed on UMAP Leiden clusters, pooled according to the determined scores. Note that ‘i/myCAFs’ share features of iCAFs and myCAFs and that the identities of 3 cell clusters could not be determined (ND) using these gene sets. (B) Genotype distribution of cells in AOM/DSS CAFs in DA regions (please refer to Fig. 2). The fraction of FibCtrl and FibΔZeb1 CAFs in each DA region or among all CAFs is shown. (C, D) Gene set enrichment analysis using Enrichr of marker genes from DAseq region 1 (C) and 3 (D) as compared to all other CAFs (Benjamini-Hochburg corrected Fisher’s exact test). (E) t-SNE sub-clustering of fibroblasts separately in FibCtrl (left) and FibΔZeb1 mice (right) of the orthotopic model showing less clusters in FibΔZeb1. (F) Cluster similarities defined by cluster annotations based on ‘SingleR’ scores (see "Methods" for details) (Aran et al, 2019). Grayscale shows the log2-transformed number of cells across clusters. Note the low similarity of FibΔZeb1 cells with FibCtrl clusters 2 and 5. (G) Heatmap showing the similarity (annotation scores) of gene expression in CAF clusters with published gene sets. Note, the high scores of FibCtrl clusters 2 and 5 when compared with ‘iCAF’ and ‘myCAF’ signatures, respectively, and absence in FibΔZeb1. Source data are available online for this figure.

