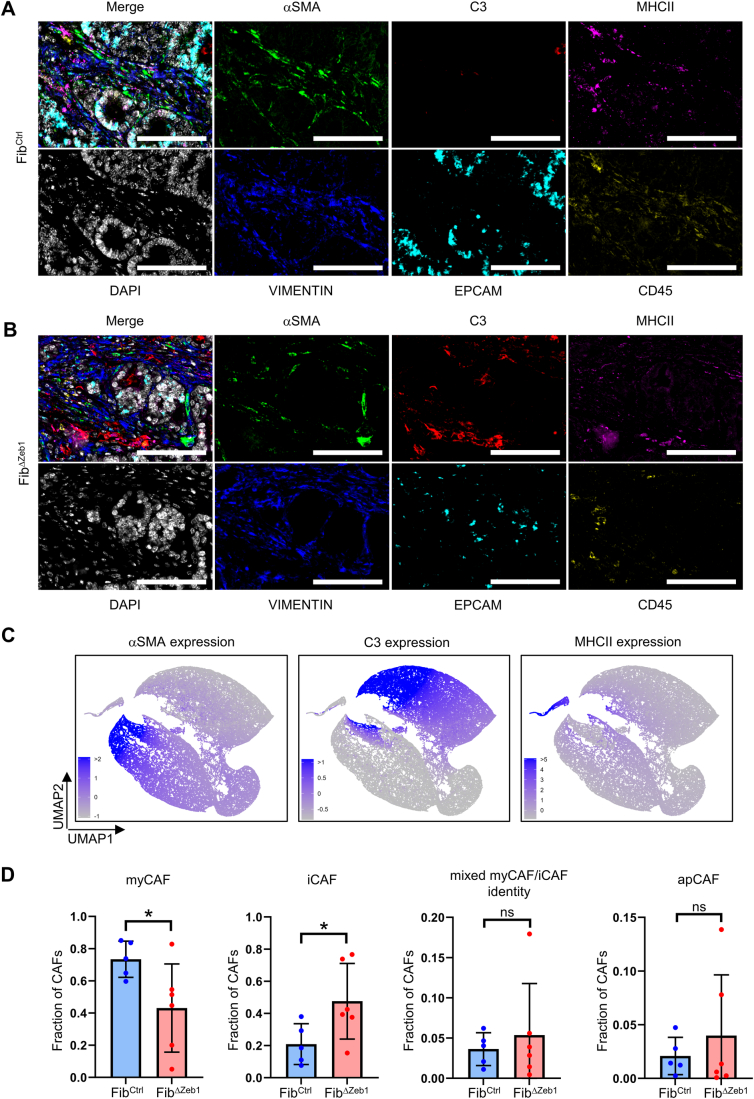
Figure EV3. Multiplexed IF staining of tumor sections reveals an enrichment of iCAF-like cells in FibΔZeb1 tumors.
(A, B) Single marker images (VIM, αSMA, C3, MHCII, EPCAM, CD45, DAPI) and merge of all channels for the representative images of FibCtrl (A) and FibΔZeb1 (B) orthotopic tumors shown in Fig. 2K. (C) Normalized staining intensities of CAF markers (αSMA, C3, MHCII) in UMAP embedding of CAFs from FibCtrl and FibΔZeb1 tumors. (D) Quantification of the distribution of CAF subtypes based on thresholds for αSMA (myCAF-like), C3 (iCAF-like) or MHCII (apCAF) staining intensity (n = 5/6 independent mice for FibCtrl/FibΔZeb1, myCAF: P = 0.0469, iCAF: P = 0.0499, Student’s t test). Data information: Data are presented as mean ± SD (D). Scale bars represent 100 µm (A, B). Source data are available online for this figure.

