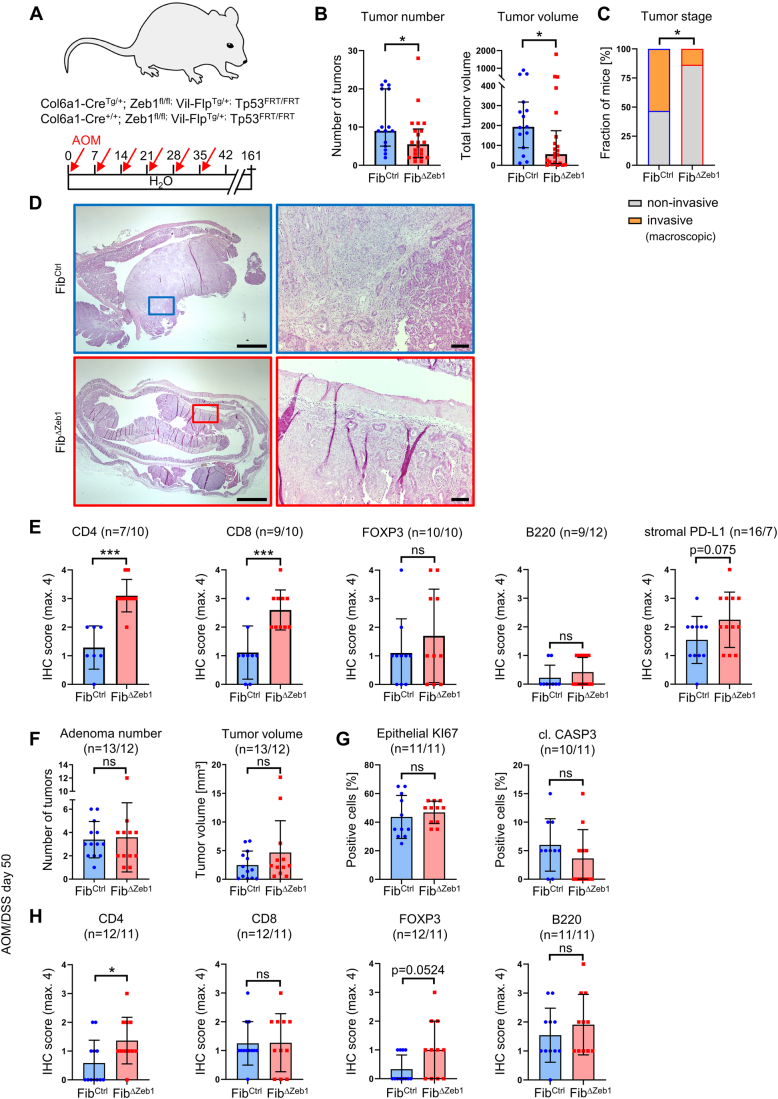
Figure EV4. Loss of Zeb1 in fibroblasts impairs tumor progression and increases T-cell infiltration in the invasive non-inflammation-driven AOM/p53 model.
(A) Schematic representation of the AOM/p53 model. (B) Quantification of numbers and volumes of tumors in the colons of FibCtrl and FibΔZeb1 mice at the endpoint (n = 15/22 for FibCtrl/ FibΔZeb1, number: P = 0.0433, volume: P = 0.0202, Mann–Whitney test). (C) Macroscopic evaluation of the most advanced/progressed tumor per mouse categorizing ‘T4’ as fully invasive (penetrating the muscle) or not (‘T1-T3’) (fraction of mice is given, n = 15/22 for FibCtrl/FibΔZeb1, P = 0.0252, Fisher’s exact test). (D) Representative H&E stainings with a higher magnification of the indicated region to the right. (E) IHC-based quantification of immune cell infiltration and stromal PD-L1 expression of tumors from FibCtrl and FibΔZeb1 mice. Numbers of experimental mice per genotype are indicated (CD4, CD8, FOXP3, B220, PD-L1: P < 0.0001, P = 0.0010, 0.3618, 0.3748, 0.0745, Student’s t test). (F–H) AOM/DSS model until day 50 in FibCtrl and FibΔZeb1 mice. Macroscopic analysis of early adenomas (number: P = 0.8339, volume: P = 0.2088, Student’s t test) (F) and IHC quantification of epithelial proliferation and cell death (KI67: P = 0.5403, cl. CASP3: P = 0.2773, Student’s t test) (G), as well as immune cell infiltration (H). Numbers of experimental mice per genotype are indicated (CD4, CD8, FOXP3, B220: P = 0.0296, 0.9515, 0.0524, 0.3996, Student’s t test). Data information: Data are presented as mean ± SD (B, E–H). Scale bars represent 1.5 mm (D, left) or 100 µm (D, right). Source data are available online for this figure.

