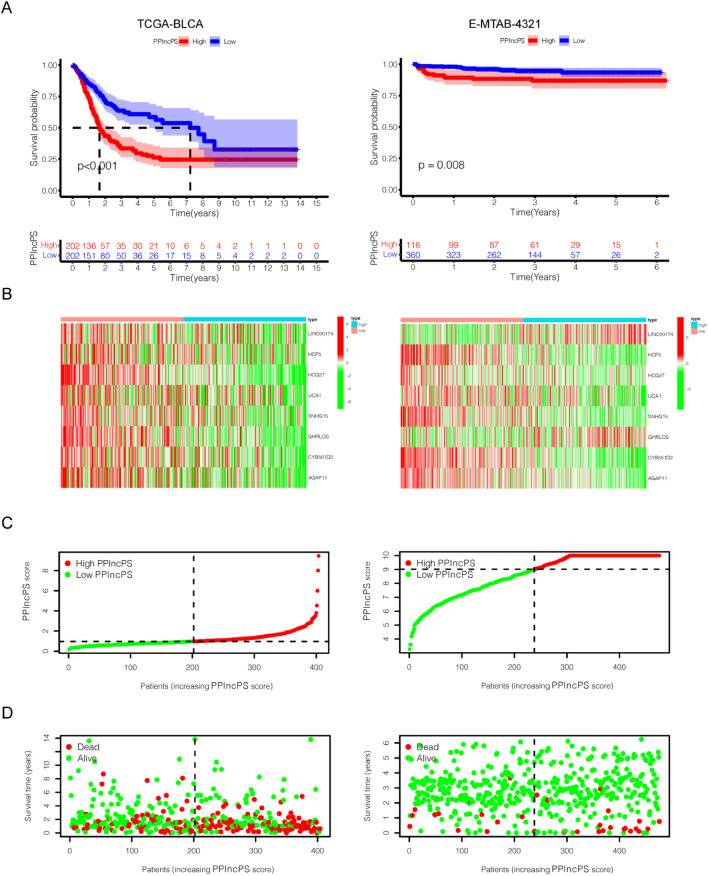
Figure 4.
PPlncPS construction in bladder cancer. The results of the TCGA-BLCA cohort were presented in the left column, and the results of the E-MTAB-4321 cohort were presented in the right column. (a) Kaplan–Meier curve revealed that the patients in the low-PPlncPS score group had a better prognosis than those in the high-PPlncPS score group (p < 0.001, p = 0.008). (b) The heatmap showed that the expression patterns of LINC00174, HCP5, HCG27, UCA1, SNHG15, GHRLOS, CYB561D2, and AGAP11 between the two groups were different in both cohorts. (c,d) Distribution of patients in the TCGA-BLCA cohort and E-MTAB-4321 cohort and survival information of each patient. PPlncPS: pan-PCD-related lncRNA prognostic signature.

