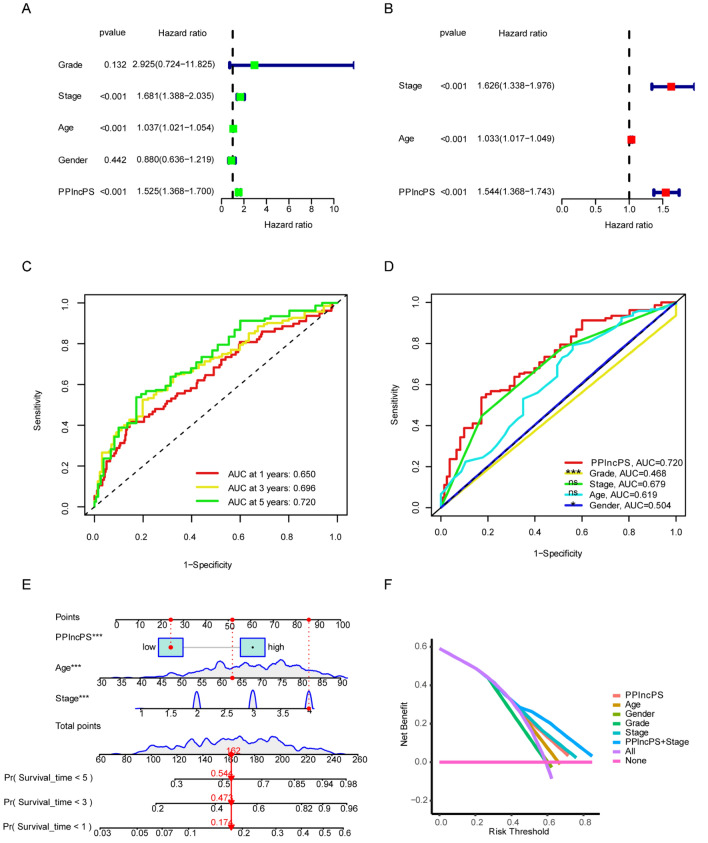
Figure 5.
Identification of independent prognostic factors based on PPlncPS score and clinical characteristics. (a,b) Prognostic analysis using univariate and multivariate Cox analyses. (c) Time-dependent ROC curves at 1, 3, and 5 years. (d) ROC curves at 5 years with the PPlncPS score and clinical features. *p < 0.05, ***p < 0.001, ns: not significant. (e) Nomogram to predict the survival probabilities at 1 year, 3 years, and 5 years. (f) Decision curve analysis (DCA) of the prognostic model predicting the net income increment risk of bladder cancer development. ROC curve: receiver operator characteristic curve.

