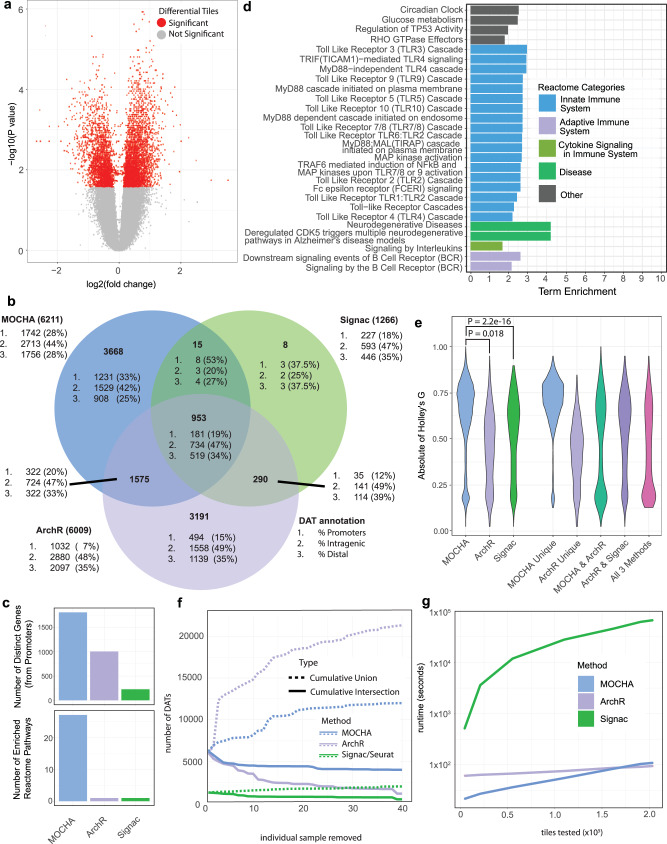
Fig. 3. Benchmarking MOCHA with ArchR and Signac on differential accessibility analysis.
a MOCHA’s differential accessible tiles (DATs) in CD16 monocytes between COVID+ samples during early infection (n = 17) and COVID- samples (n = 22) in the COVID19X dataset. The volcano plot illustrates the log2(FC) on the x-axis against the -log10(P value) on the y-axis, where FC represents fold change in accessibility. The log2(FC) was estimated using the Hodges-Lehmann estimator110. The P value was calculated based on the two-part Wilcoxon test (two-sided, zero-inflated)35. DATs with a false discovery rate (FDR) < 0.2 were considered as significant. b Venn Diagram of MOCHA, Signac, and ArchR’s DATs. The count and percentage of 1) promoters, 2) intragenic tiles, and 3) distal tiles are shown for each method and each Venn diagram subset. c The number of (top) genes with differential promoters and (bottom) enriched Reactome pathways for each method are depicted using barplots. d Reactome Pathway enrichment results based on genes with differential promoter tiles. Pathway categories are annotated using Reactome’s pathway hierarchy. e Violin plot of Holley’s |G| from 1000 bootstrapped samples, each containing 50 randomly selected DATs from each category. Categories with <50 DATs were not tested. Two-sided Wilcoxon rank-sum test was used. f Leave-one-sample perturbation analysis to test the robustness of each method in differential accessibility analysis. New sets of DATs were calculated iteratively after removing each sample once. The robustness was assessed by the number of total (solid line) and conserved (dotted line) DATs detected across perturbations. g Each method’s runtime (in seconds) as a function of the number of tested tiles. Source data is provided in “SourceData_Figure3-S10.xlsx”. Panels were generated using Adobe Illustrator.

