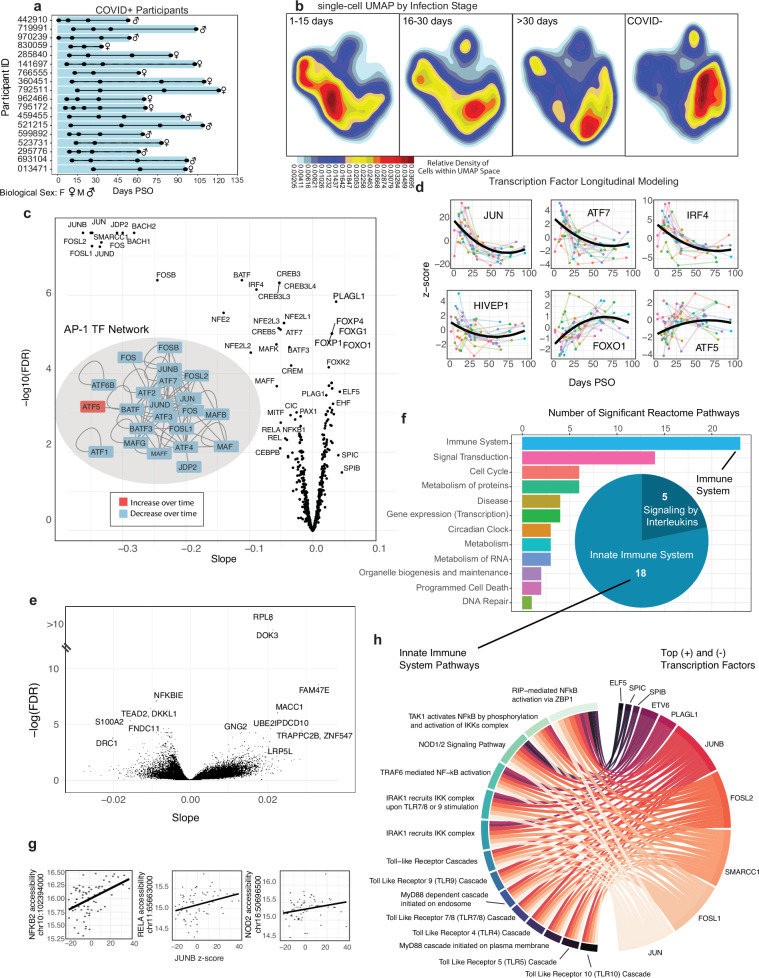
Fig. 5. Integrative analyses to reveal longitudinal dynamics in CD16 monocytes during COVID-19 recovery.
a Longitudinal COVID19 cohort overview (n = 18). Time points indicated by black dots illustrate sample availability for each COVID+ participant. b Single-cell Density UMAPs using open regions in CD16 monocytes from MOCHA (full COVID19 dataset, n = 91 samples), showing cells from COVID+ samples during early infection (1–15 days PSO, n = 21), late infection (16–30 days PSO, n = 13), and recovery (>30 days PSO, n = 35), and COVID- samples (n = 22). c Volcano plot illustrating the −log10(FDR) vs. the slope of motif usage over time. Motif usage quantified using Z-scores from ChromVAR run on the TSAM. Insert: The network showing interacting TFs within the AP-1 family (APID database118). TFs were color-coded by the sign of their slope. d Longitudinal motif usage over time for an exemplary set of TFs. Individual participants and population trends are shown with thin lines (colored-coded by subject), and thick black lines (population trend). e Volcano plot illustrating the −log10(FDR) vs. the slope of promoter accessibility over time based on (ZI-GLMM). A subset of the top promoters are labeled with their corresponding genes. f Significant Reactome pathways (FDR < 0.1) enriched for genes with significant promoter accessibility changes. The pathways were aggregated into upper-level pathway annotations using Reactome’s database hierarchy. The barplot shows the number of pathways in each category. The pie chart breaks down the immune system pathways by Reactome’s next level categories. g Three scatter plots illustrating examples of associations between promoter accessibility (y-axis) and JUNB’s ChromVar z-score (x-axis). The thick black line shows the population trend from ZI-GLMM. h Bipartite network illustrating associations between the top 5 motifs (largest positive (+) or negative (−) slope) and 14 significant innate immune pathways. Motif-promoter associations only shown if Motif is related to >33% of significant genes in a pathway. c–h Data from CD16 monocytes in the COVID19L dataset (n = 69). PSO post symptom onset, UMAP Uniform Manifold Approximation and Projection, TSAM tile-sample accessibility matrix, FDR false discovery rate, TF transcription factor, AP-1 activator protein-1, ZI-GLMM zero-inflated generalized linear mixed model. Source data is provided in “SourceData_Figure5.xlsx”, including precise FDR values. Panels were generated using Adobe Illustrator.

