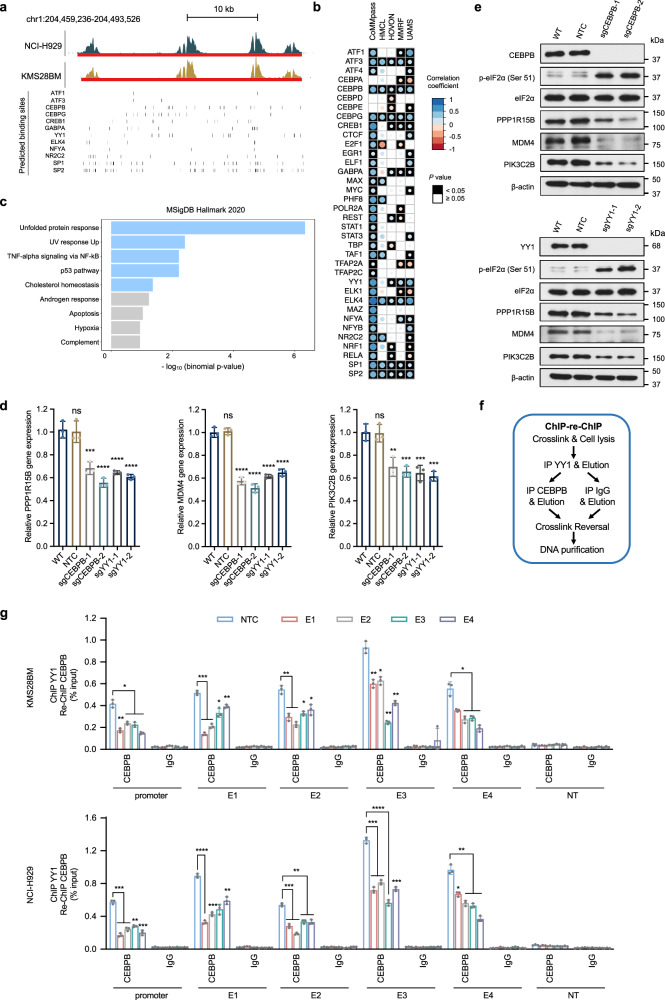
Fig. 5. CEBPB and YY1 regulate the transcription of PPP1R15B by binding to its promoter and super-enhancer.
a Genome browser views of the putative binding sites of prominent TFs predicted using FIMO and JASPAR motifs. Vertical bars correspond to the predicted binding sites for each TF. b Correlation patterns between TFs and PPP1R15B based on publicly available CoMMpass RNA-seq dataset40 and microarray datasets (HMCL65, HOVON63, MMRF64, UAMS59). Univariate analysis was performed using Spearman correlation analysis. Circle radius and color represent the correlation coefficient (Spearman Rho), and the color of the squares represents statistical significance (p value). c Functional enrichment analysis for a list of 12 TFs whose expression positively correlates with PPP1R15B level in ≥ 3 datasets with statistical significance (Spearman Rho > 0, p ≤ 0.05), showing enriched pathway terms curated from the MSigDB hallmark. P values were calculated using one-sided Fisher’s exact test and were adjusted using the Benjamini-Hochberg method. d, e Cas9-expressing KMS28BM were transfected with NTC sgRNA or sgRNA targeting CEBPB or YY1. Effects of CEBPB or YY knockout on the mRNA (d) and protein (e) levels of PPP1R15B, MDM4, PIK3C2B in KMS28BM. For RT-qPCR, n = 3 biological replicates. One-way ANOVA with Tukey’s post hoc test was performed (All p values in WT vs sgCEBPB/sgYY1 < 0.01. Detailed calculations of p values are provided in the Source Data file). All western blots are representative of 3 biological replicates. β-actin was used as a loading control. f, g ChIP-qPCR analysis of CEBPB and YY1 co-recruitment at PPP1R15B gene and SE loci using ChIP-re-ChIP (f). Epigenetic silencing of SE led to diminished co-recruitment of CEBPB and YY1 in KMS28BM and NCI-H929 cells (g). Significant differences were determined using two-way ANOVA with Tukey’s post hoc test (All p values in NTC vs E1/E2/E3/E4/E1-4 < 0.05. Detailed calculations of p values are provided in the Source Data file). n = 3 biological replicates. Data are presented as mean ± SD. NT non-transcribed region. Source data are provided as a Source Data file.

