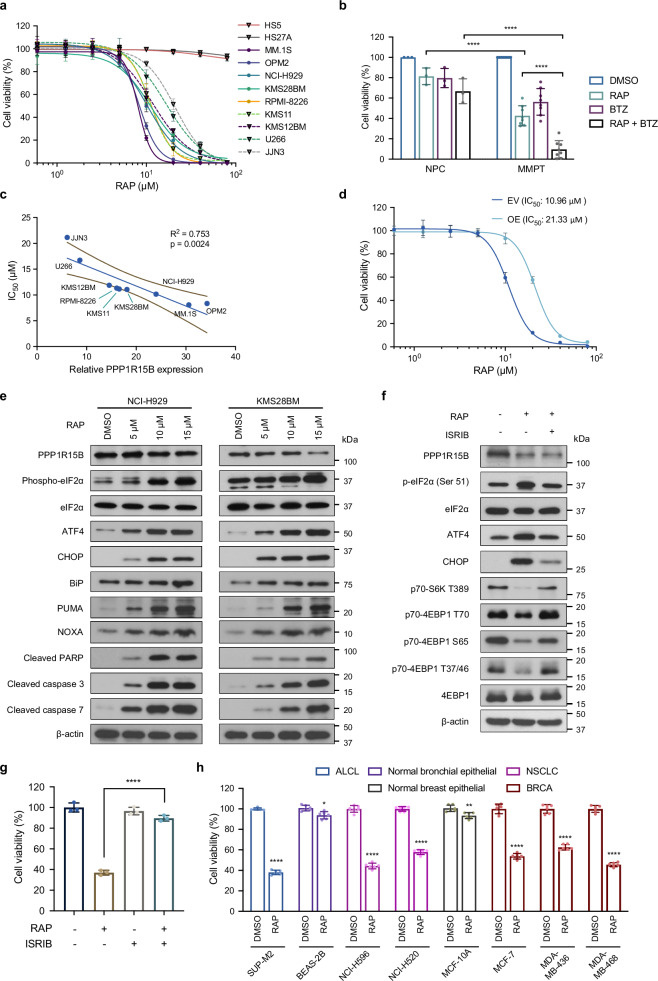
Fig. 9. Therapeutic potential of targeting PPP1R15B using a selective phosphatase inhibitor Raphin1.
a Dose response for stromal cell lines (HS5, HS27A) and HMCLs (n = 9), treated with Raphin1 for 48 hours. n = 4 biological replicates. b Combination treatment with 10 μM Raphin1 and/or 2.5 nM bortezomib on NPCs (n = 3) and patient-derived myeloma cells (n = 8) for 48 hours. Two-way ANOVA with Tukey’s post hoc test was performed (p values in NPC:RAP vs MMPT:RAP = 7.51×10⁻⁶; NPC:RAP + BTZ vs MMPT:RAP + BTZ = 1.30×10⁻⁹; MMPT:RAP vs MMPT:RAP + BTZ = 4.18×10⁻⁷). c Correlation of PPP1R15B expression with drug response of Raphin1. Each dot represents a HMCL. Univariate linear regression analysis was performed, with coefficient of determination R2 and p value shown. Solid line represents the fitted linear regression curve, and dashed lines indicate 95% confidence band. d Cell viability of U266 overexpressing PPP1R15B or EV control after 48-hour Raphin1 treatment. n = 3 biological replicates. e Immunoblot analysis of UPR and apoptotic markers after 72-hour Raphin1 treatment. All western blots are representative of 3 biological replicates. β-actin was used as a loading control. f Immunoblot analysis of UPR and mTORC1 pathways in NCI-H929 treated with 10 μM Raphin1 and/or 100 nM ISRIB for 72 hours. All western blots are representative of 3 biological replicates. g Effects of Raphin1 (10 μM) and ISRIB (100 nM) on cell viability of NCI-H929 after 48 hours. n = 3 biological replicates. One-way ANOVA with Tukey’s post hoc test was performed (p values in RAP vs DMSO = 4.95 × 10⁻⁸; RAP vs RAP + ISRIB = 2.47 × 10⁻⁷). h Cell viability of other cancer cell lines exhibiting relatively high PPP1R15B expression and the related normal cells (BEAS-2B, MCF-10A) after 48-hour treatment with 10 μM Raphin1 or DMSO. n = 6 biological replicates. Two-way ANOVA with Tukey’s post hoc test was performed (Detailed calculations of p values are provided in the Source Data file). Data presented as mean ± SD. RAP Raphin1, BTZ Bortezomib, ALCL Anaplastic large cell lymphoma, NSCLC Non-small cell lung cancer, BRCA Breast invasive carcinoma. Source data are provided as a Source Data file.

