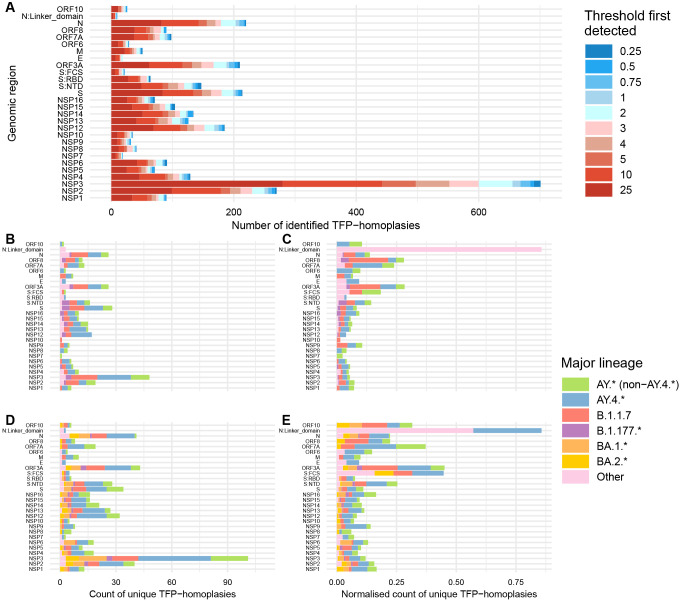
Figure 3. Frequency of SARS-CoV-2 TFP-homoplasies per genomic region considering all cluster thresholds and the more reliable threshold of 2%.
( A) Count of TFP-homoplasic sites for all SARS-CoV-2 proteins across the 10 different cluster thresholds ranging from the more (0.25%) to the less stringent (25%). ( B– E) Count of TFP-homoplasies per genomic region for two different time periods and considering threshold = 2%. ( B) Non-normalised counts per lineage for timeframe pre-Omicron (June 2020 to mid-November 2021). ( C) Normalised counts per lineage (divided by genomic size) for the same period as ( B). ( D) Non-normalised counts for the timeframe including Omicron (June 2020 to end of April 2022). ( E) Normalised counts for the same period as ( D).

