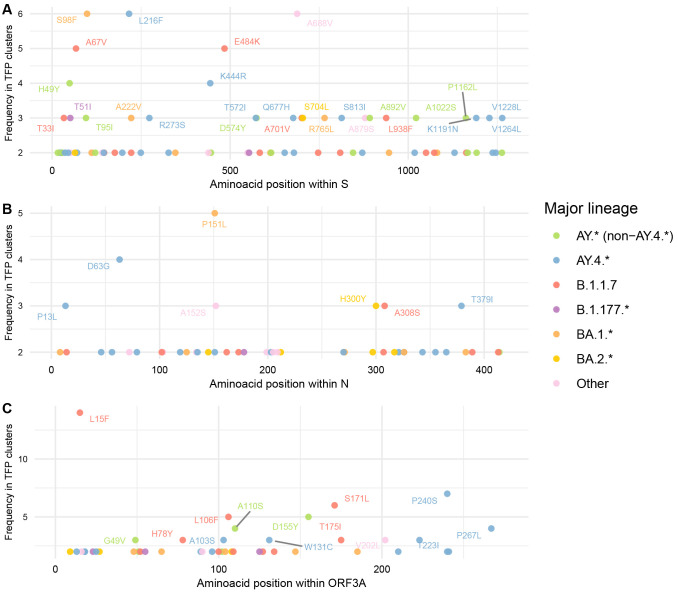
Figure 5. Frequency of identified TFP-homoplasies alongside genomic regions with major functional significance and normalised counts for cluster threshold = 2% and period including Omicron.
( A) Spike. ( B) Nucleocapsid. ( C) ORF3a. TFPs are coloured by major PANGO-lineage and annotated if frequency > 2.

