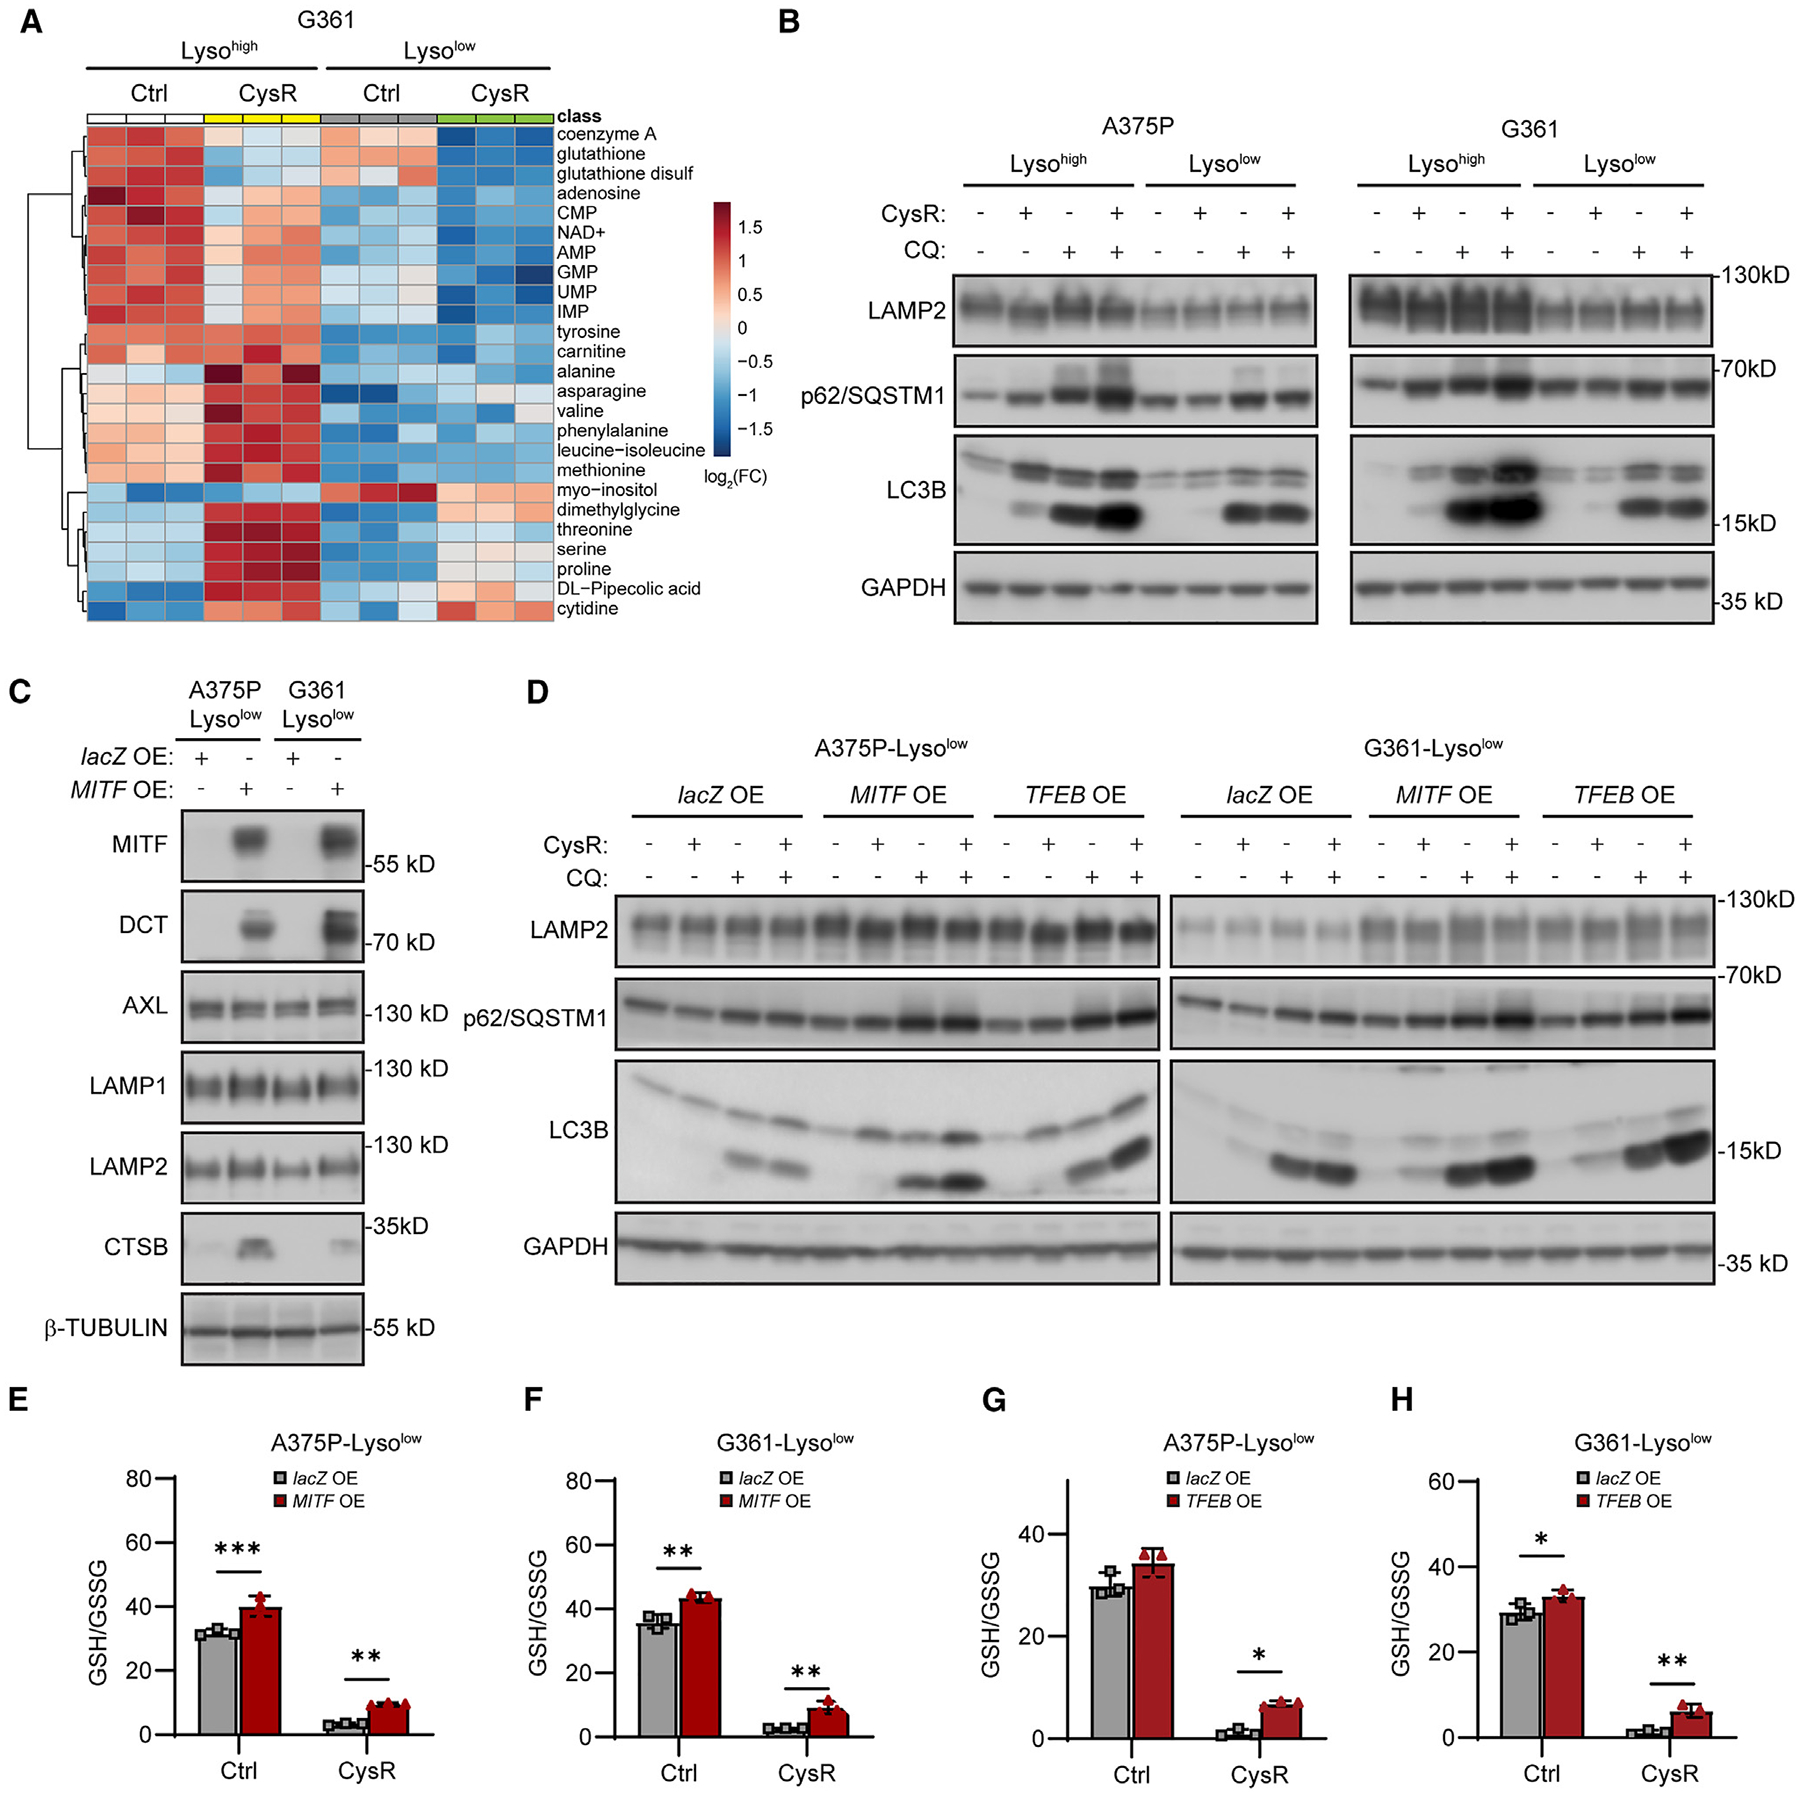
Figure 3. MITF or TFEB overexpression restores lysosome functions and hallmarks of autophagy in response to cysteine restriction and rescues glutathione levels.

(A) Heatmap of the top 25 altered lysosomal metabolites between G361 Lysohigh and Lysolow in response to 16 h cysteine restriction (CysR). Lyso-IP experiment performed in triplicate followed by metabolite extraction, and metabolite level changes compared in pairs Lysohigh Ctrl vs. Lysohigh CysR, and Lysolow Ctrl vs. Lysolow CysR.
(B) Immunoblot analysis of LAMP2, p62/SQSTM1, and LC3B in the indicated Lysohigh and Lysolow cells in response to 16 h CysR and 100 μM chloroquine (CQ) treatment.
(C) Immunoblot analysis of the indicated proteins in Lysolow A375P and G361 cells overexpressing lacZ or MITF.
(D) Immunoblot analysis of LAMP2, p62/SQSTM1 and LC3B levels in Lysolow cells overexpressing lacZ, MITF, or TFEB in response to 16 h CysR or treatment with 100 μM CQ.
(E–H) Effects of CysR for 16 h on GSH/GSSG ratios within (E) A375P and (F) G361 Lysolow cells overexpressing lacZ or MITF, and (G) A375P and (H) G361 overexpressing lacZ or TFEB.
Data shown as mean ± SD with statistical significance based on unpaired two-tailed t test. *p < 0.05, **p < 0.01, ***p < 0.001, ****p < 0.0001.
See also Figures S5 and S6.
