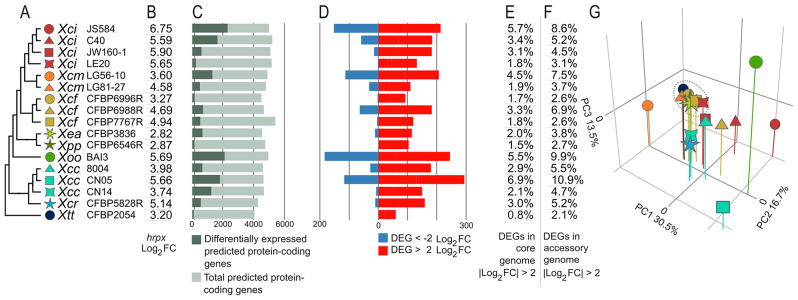
Fig. 2.
Features of the HrpG* regulons in 17 Xanthomonas strains. A: Phylogenetic tree of all strains as shown in Fig. 1A. B: Log2FC of hrpX in hrpG* strains compared to wild-type. C: Proportion of differentially-expressed predicted protein-coding genes per genome (AdjPval < 0.05). D: Number of DEGs (|Log2FC| > 2). E: Percentage of DEGs (|Log2FC| > 2) in the core genome only considering protein-coding genes. F: Percentage of DEGs (|Log2FC| > 2) in the accessory genome only considering protein-coding genes. G: Principal components analysis plot showing the first three principal components based on the average Log2FC of genes within each orthogroups of the core genome

