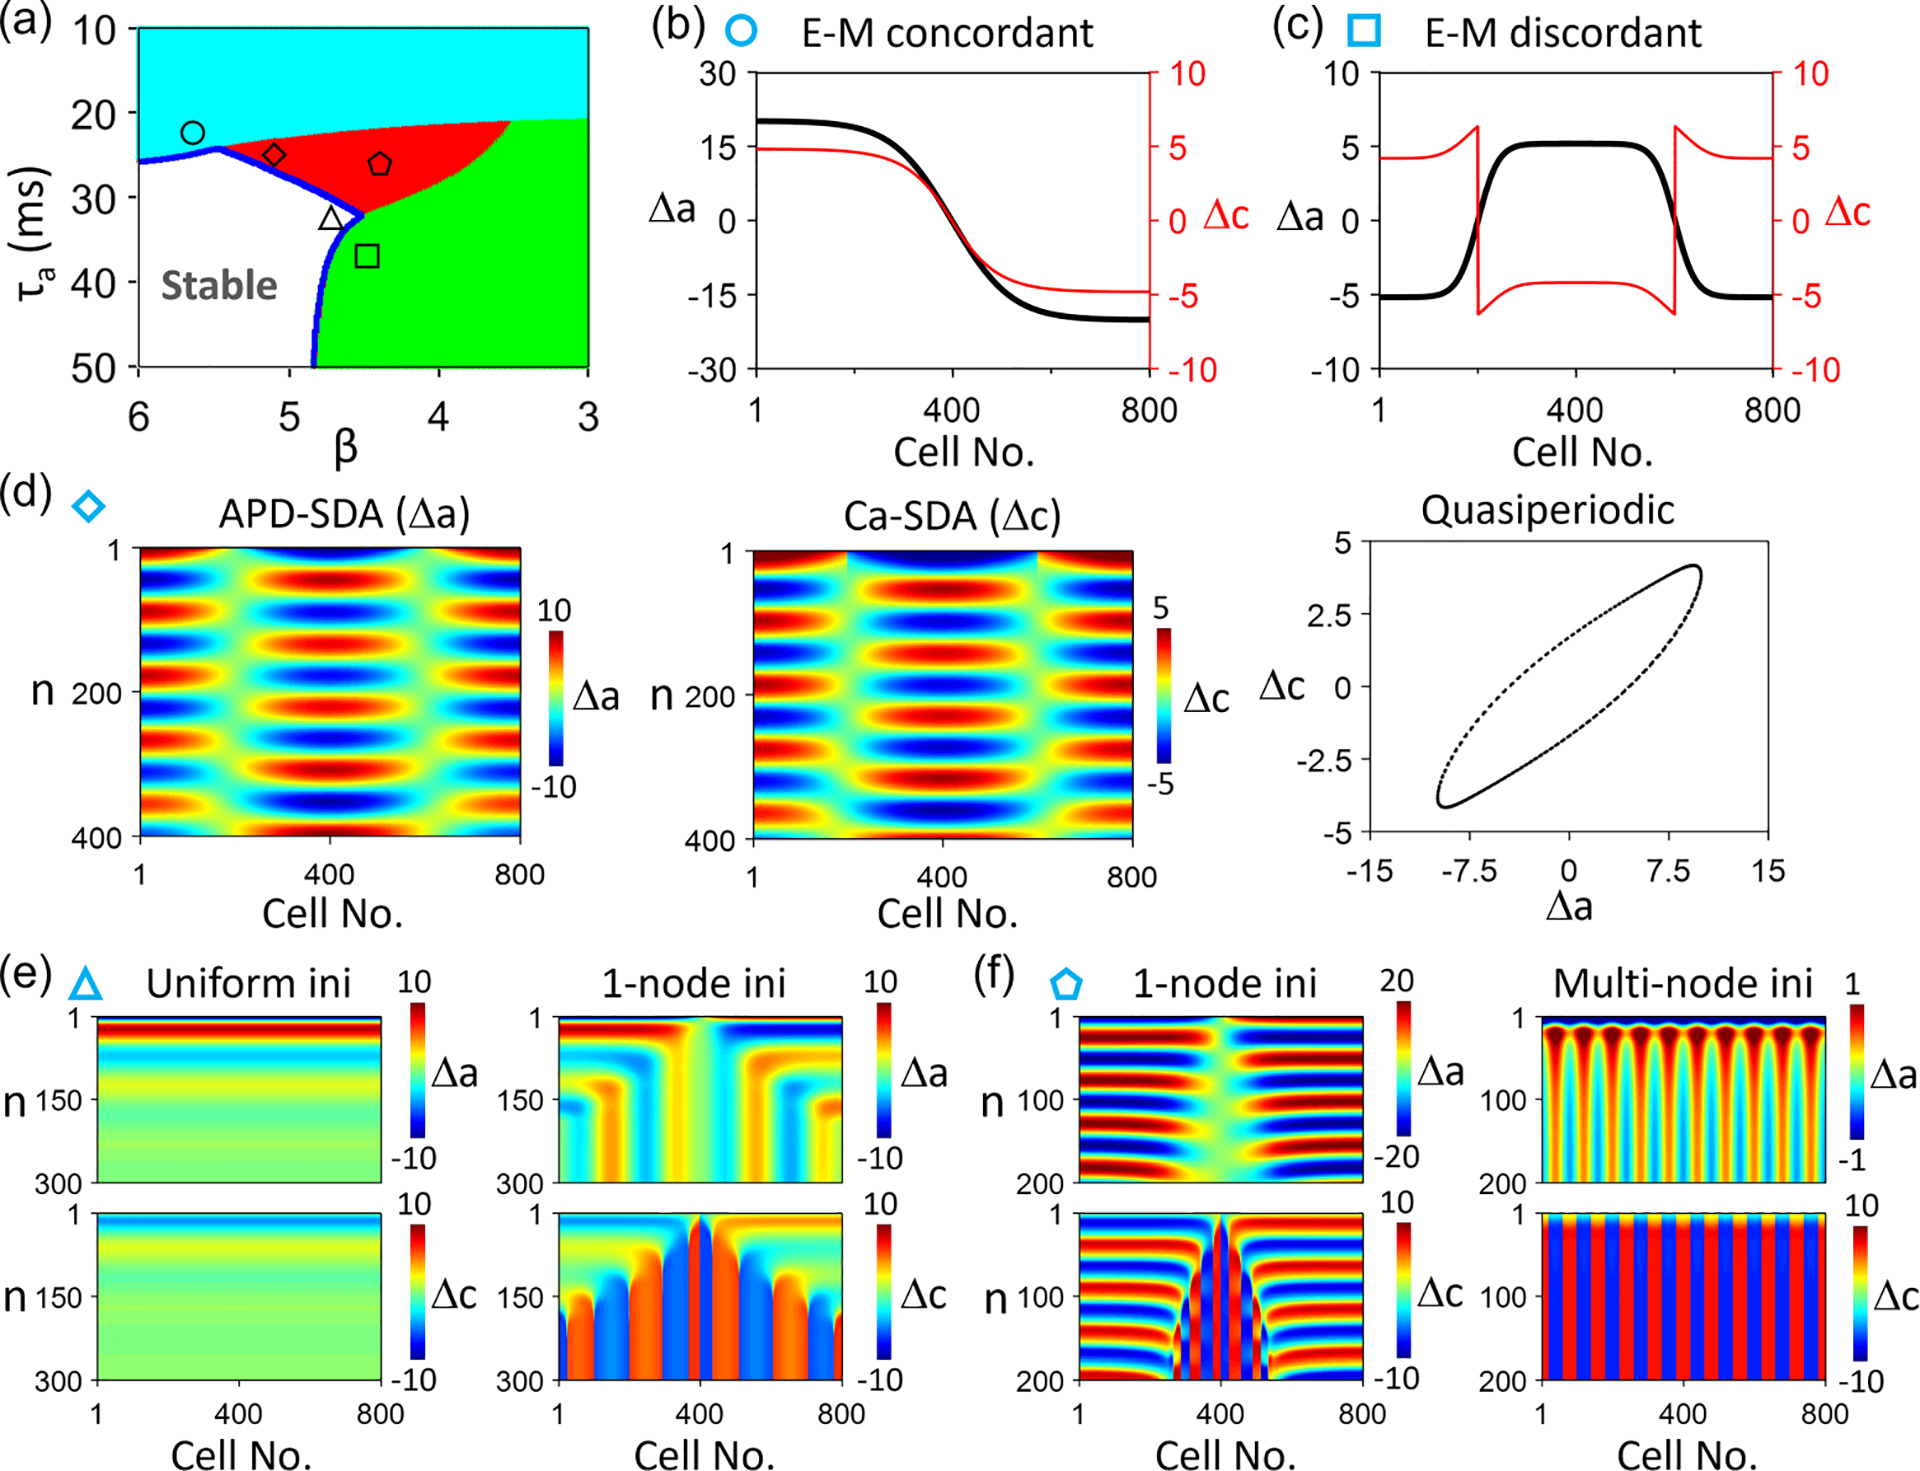
FIG. 10.

Spatiotemporal Ca and action potential duration (APD) dynamics in the coupled map lattice (CML) model for . (a) Phase diagram showing different Ca and APD dynamics vs and in a single cell. White: stable steady state; cyan: electromechanically concordant alternans; green: electromechanically discordant alternans; and red: quasiperiodicity. , and . (b) Steady-state (black) and (red) showing an electromechanically concordant spatially discordant alternans (SDA). and , marked by the circle in (a). (c) Steady-state (black) and (red) showing an electromechanically discordant SDA. and , marked by the square in (a). (d) Space-time color-scale plots of (left) and (middle) showing a quasiperiodic SDA (right). and , marked by the diamond in (a). (e) A uniform initial condition leads to a stable steady state (left, no alternans), but a nonuniform (one-node) initial condition leads to multinode electromechanically discordant SDA (right). and , marked by the triangle in (a). (f) A one-node initial condition leads to a quasiperiodic SDA (left), but a multinode initial condition leads to a multinode electromechanically discordant SDA. and , marked by the pentagon in (a). In (e) and (f), the upper panels are color-scale plots of , and the lower panels are those of .
