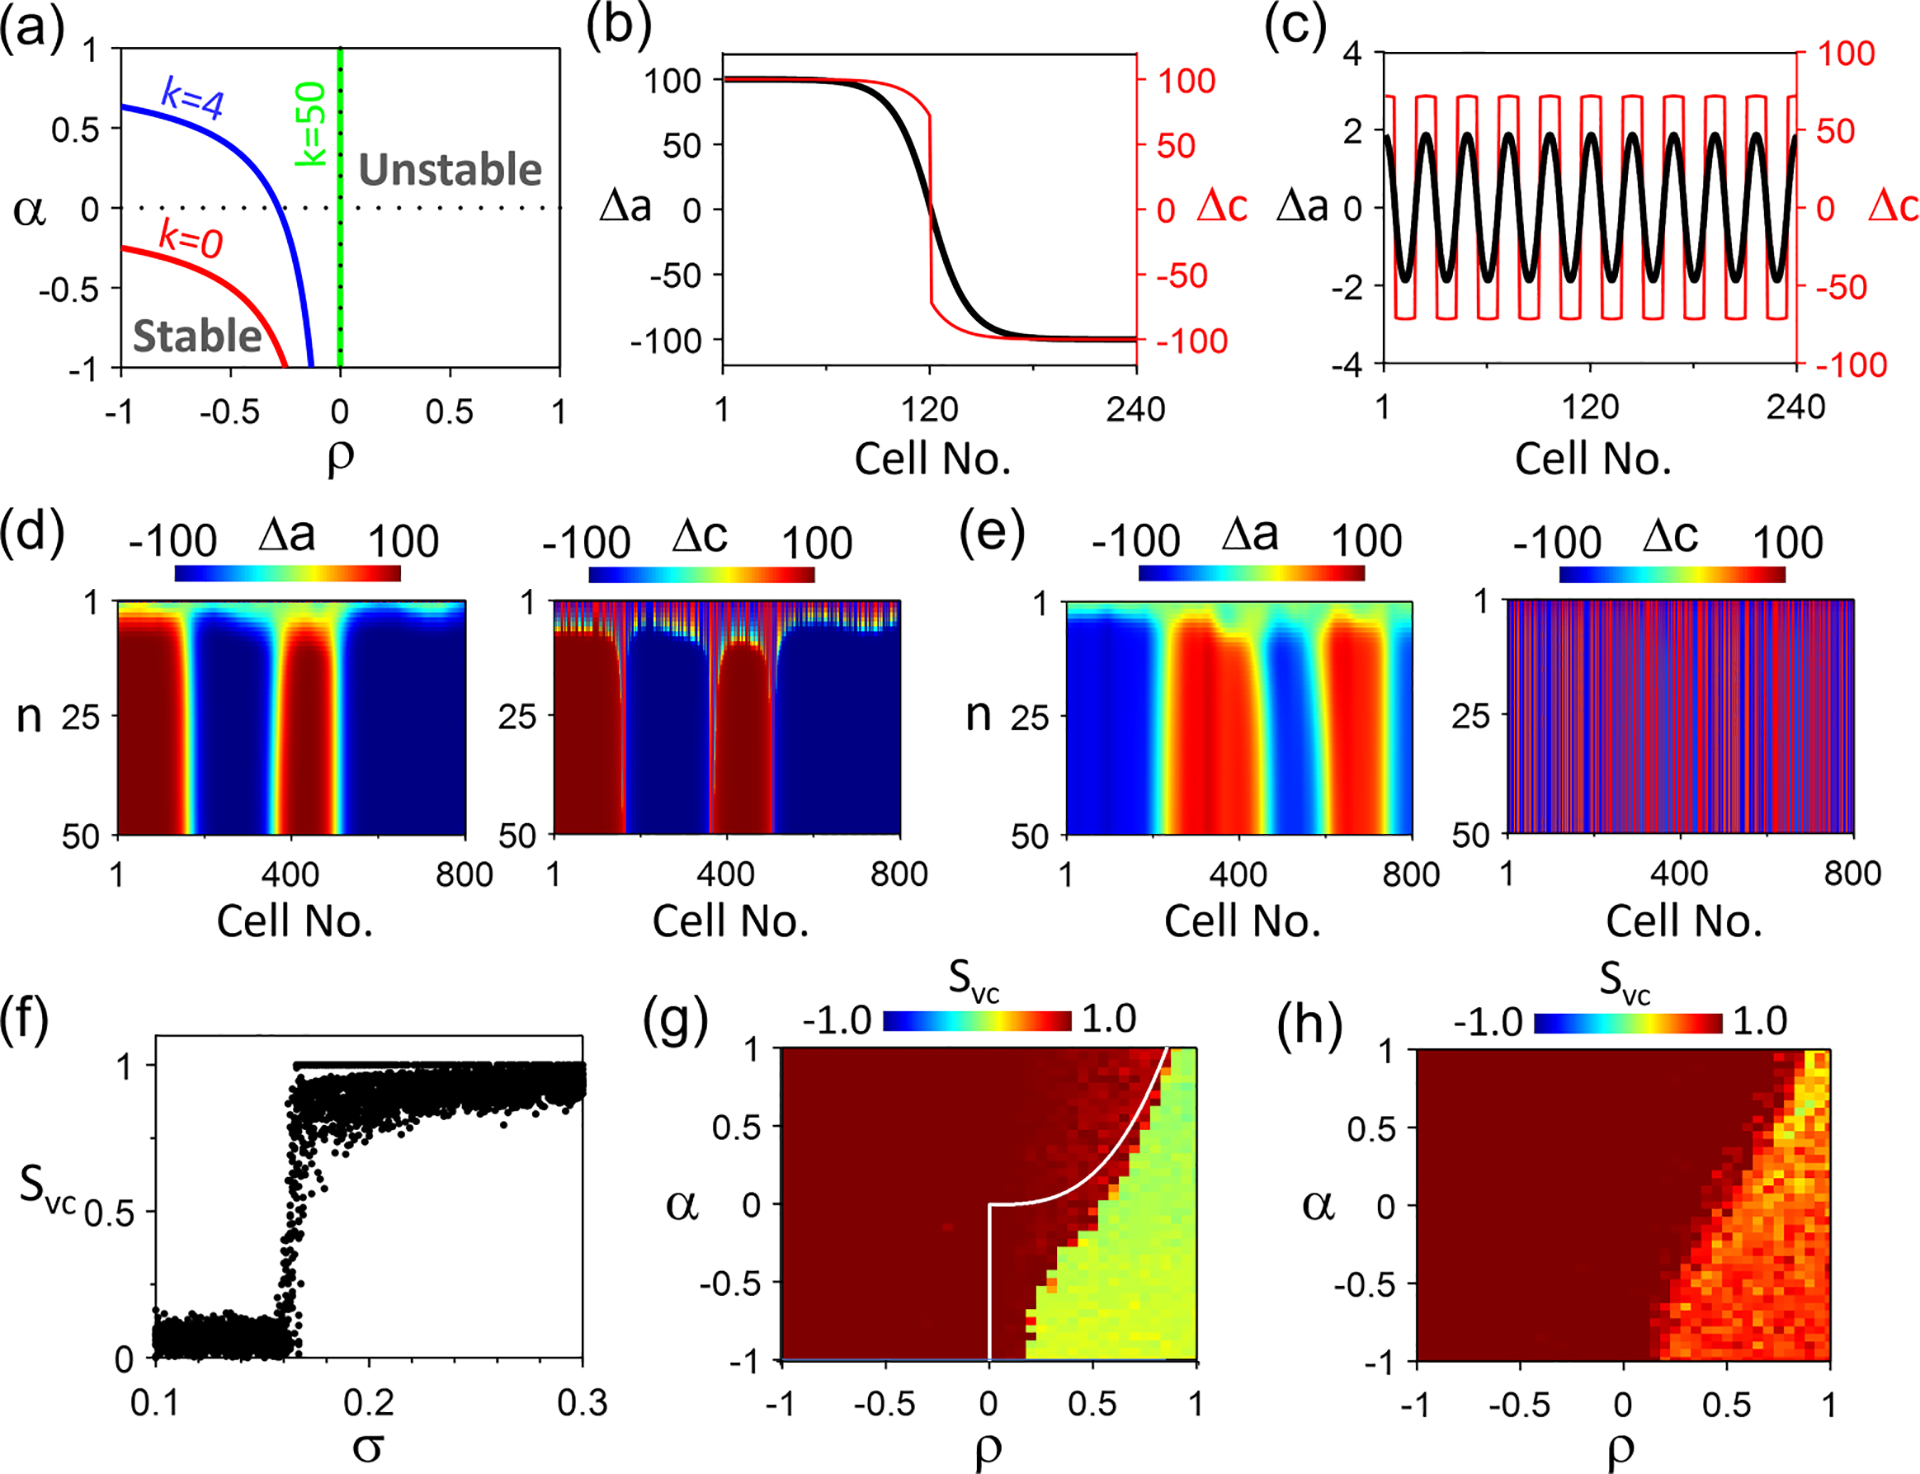
FIG. 6.

Spatiotemporal Ca and action potential duration (APD) dynamics in the amplitude equation (AE) model for . (a) Stability boundaries (colored lines) in the plane for different spatial modes of the linear stability analysis of the steady state. Shown are the boundary for (red), 4 (blue), and 50 (green). and . (b) Steady-state (black) and (red) in space for beat no. 100 with 1 node in both and . (c) Same as (b) but with 20 nodes in both and . (d) Space-time plots of and with an initial condition of and random in which is a binary number, uniformly chosen as either −100 or 100. and . (e) Same as (d) but with . (f) vs . For each values from different initial conditions as in (c) and (d) are plotted. . (g) Color map of vs and . For each set of and , one random initial condition (spatial scale cell) is simulated. and . The white line is the synchronization boundary predicted by Eq. (13) under , showing that positive Ca-to-APD coupling () enhances spontaneous synchronization. (h) Same as (g) but with a larger spatial scale of the initial conditions: cells.
