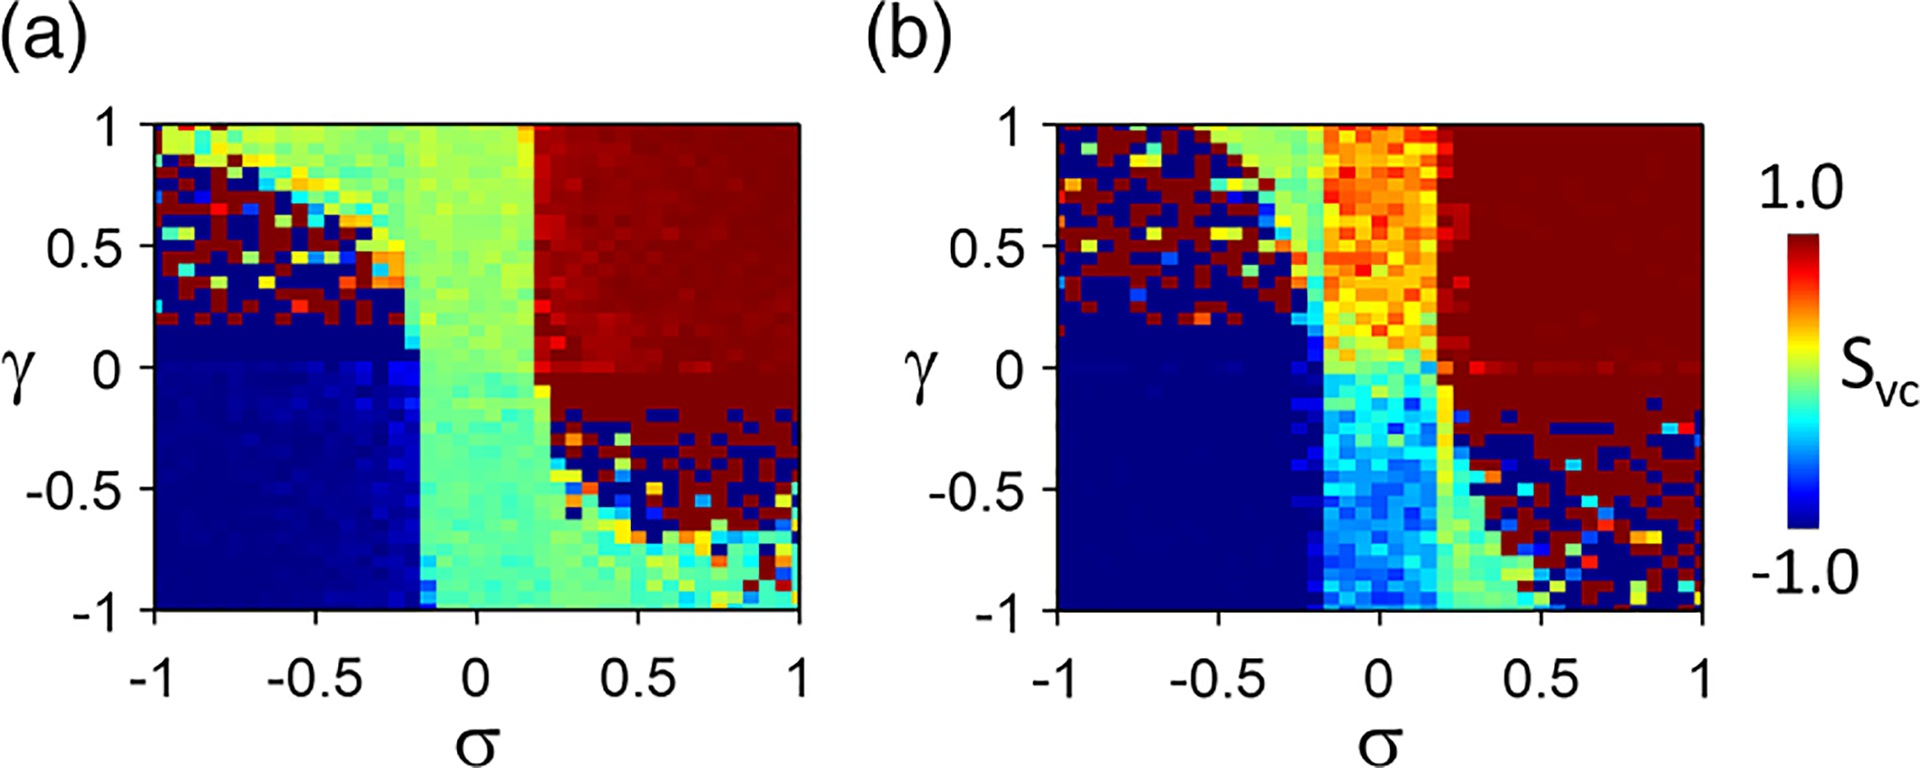
FIG. 8.

Color maps of vs and in the amplitude equation (AE) model. (a) Purely random initial conditions of and (spatial scale cell). (b) Random initial conditions with a spatial scale of cells. and . Note that in the upper-left and lower-right quadrals, , the spatially discordant alternans (SDA) dynamics is quasiperiodic, measured at the last beat depends on the status the SDA pattern, which varies from beat to beat. Therefore, the values in these two quadrals exhibit a randomlike pattern in the color map. In the upper-right (electromechanically concordant) and lower-left (electromechanically discordant) quadrals, the SDA patterns are phase-locked and stable.
