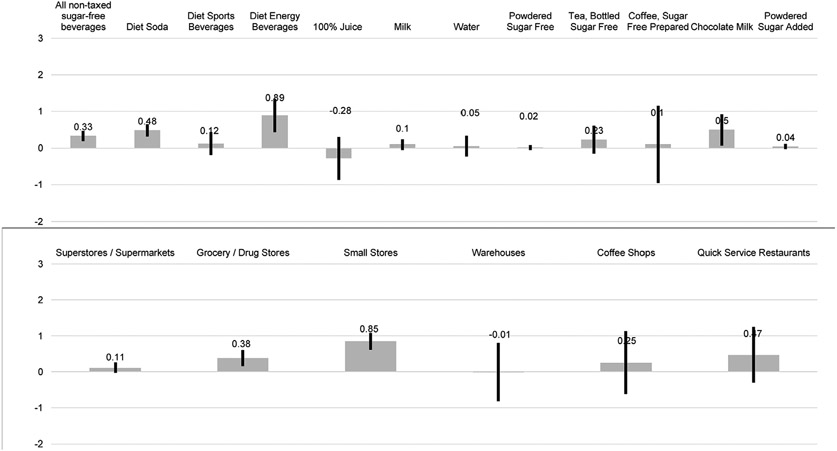
Fig. 2. Adjusted estimated effect of the tax on prices of non-taxed beverages (in cents per ounce) in Seattle at 6-months post-tax from balanced difference-in-difference models.
Difference-in-difference point estimates and confidence intervals are displayed. Panel A displays the pooled estimate for all non-taxed, sugar-free beverages and the estimates from beverage-type-stratified models. Panel B displays estimates from store-type-stratified models.

