
Figure 2: Modeling personalized estimates for parameters reflecting the dynamics of anxiety.
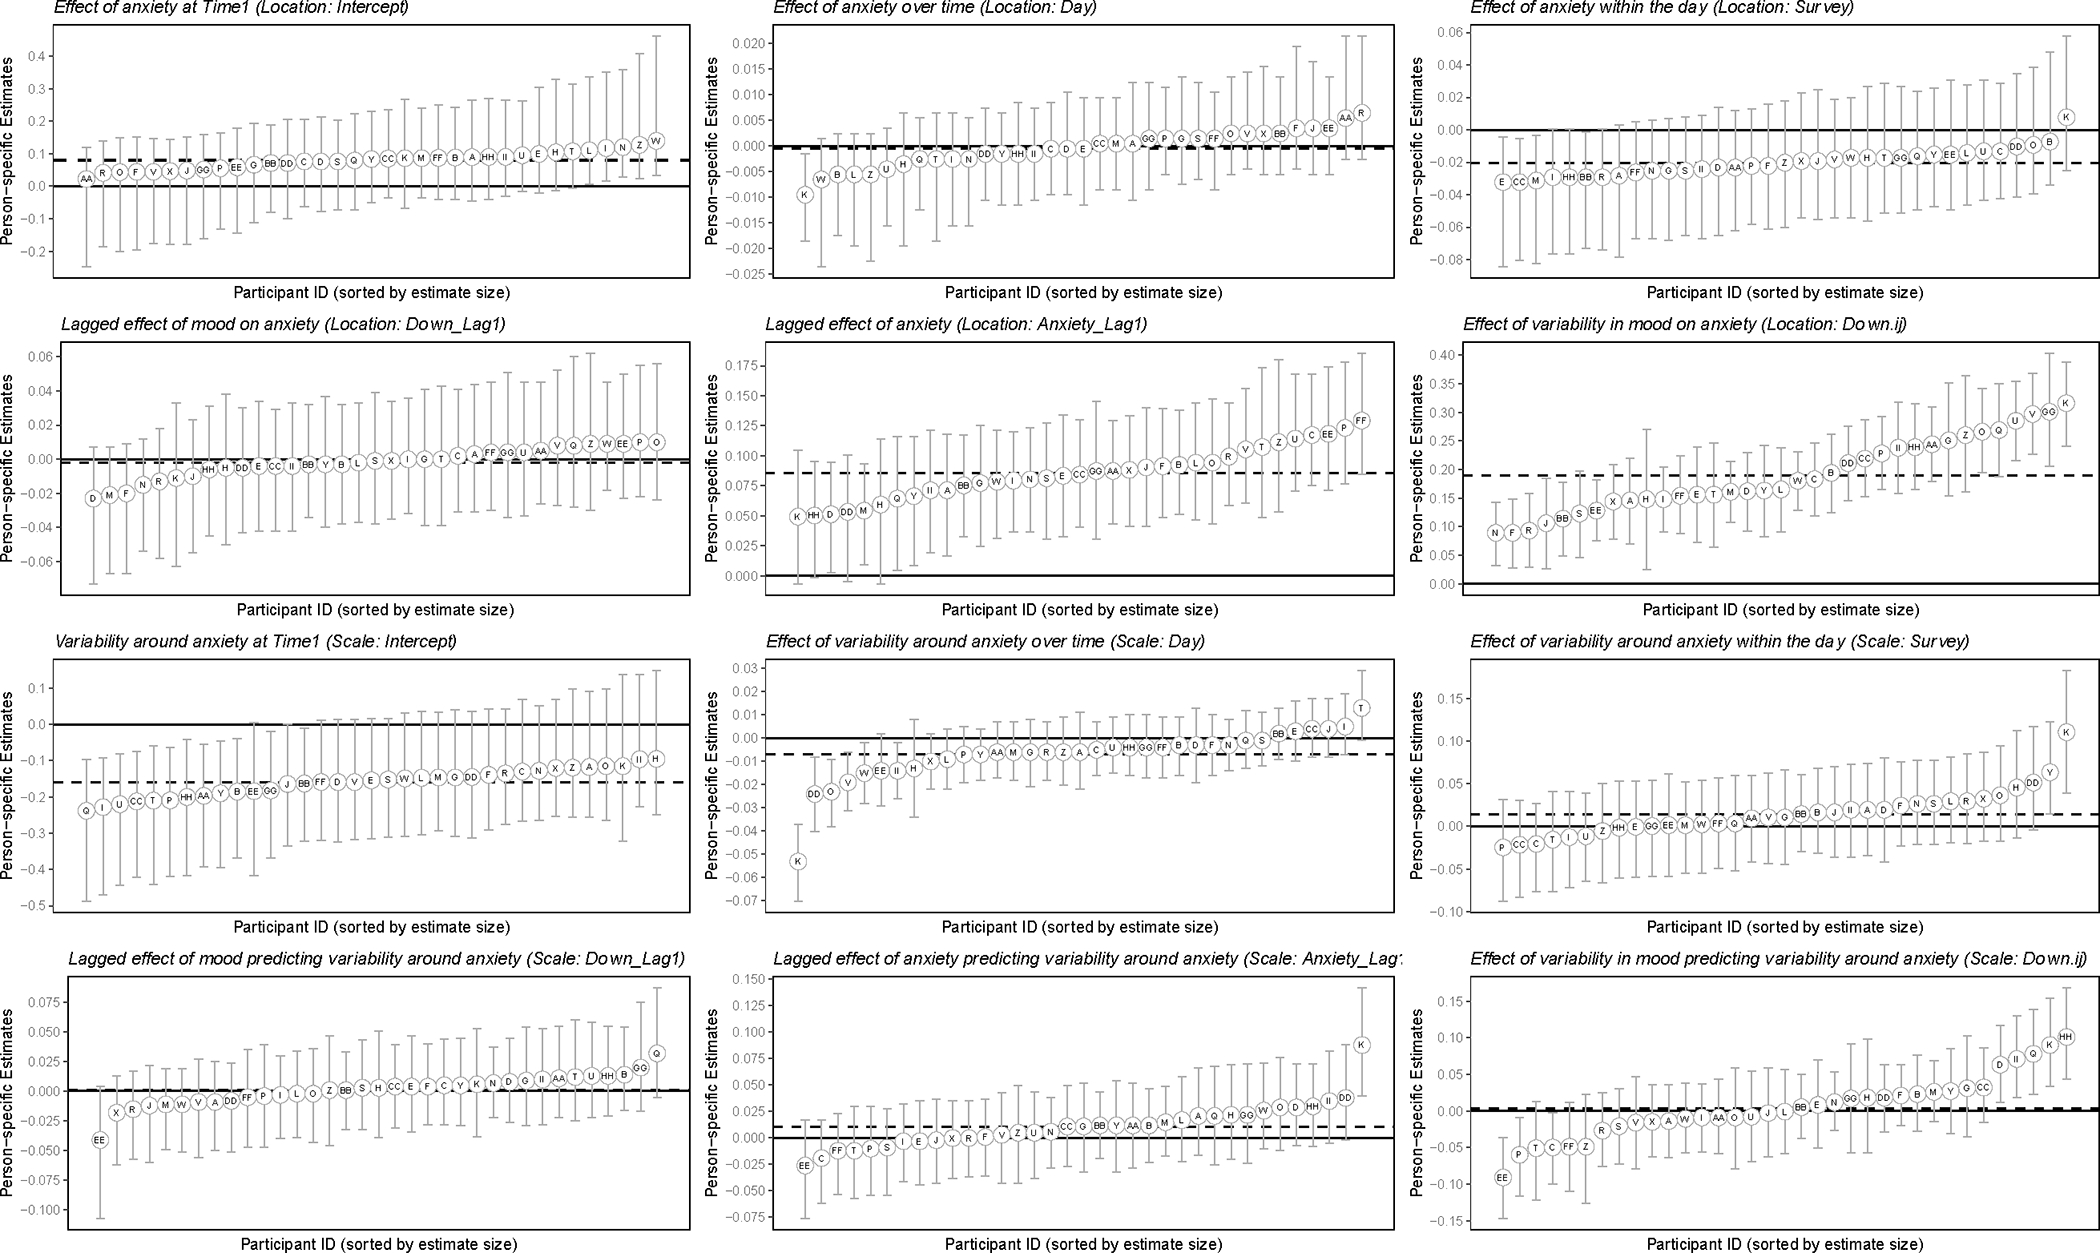
Note. Error bars represent the 90% credible interval around each predicted personalized estimate (fixed effect plus random effect). 90% CI refers to the credible interval (CI) around the posterior distribution. The 90% CI denotes the interval that the associated estimate lies within, with 90% certainty. If the 90% CI does not include 0, the estimate is likely to be non-zero, with 95% certainty. The fixed effect is represented with a hashed line.