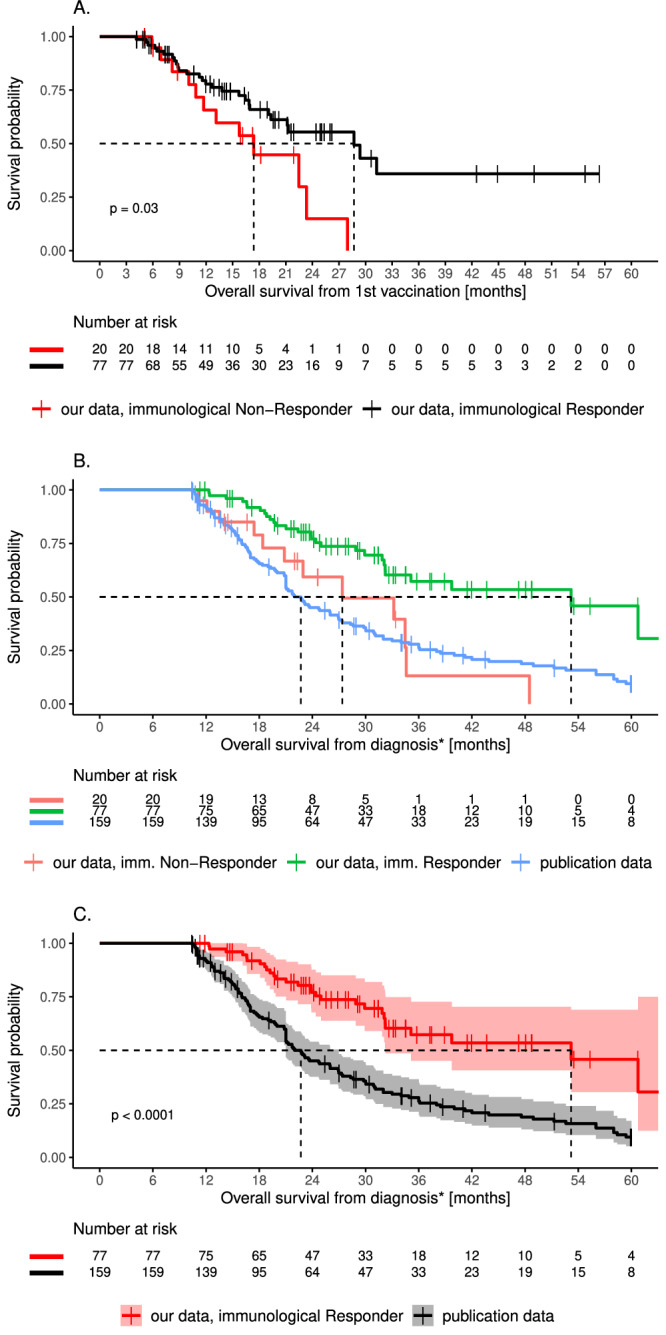
Fig. 3. Survival of immunological responders and non-responders and the matching cohort.

A On-treatment survival of immunological responders (iR; black) and non-responders (iNR; red). Significance is given for the comparison between patients with and without positive T-cell response (P = 0.03). B OS of our iR (green, 53.2 months, P < 0.0001 vs publication data) and iNR (red, 27.4 months, P = 0.74 vs publication data) and the matching cohort (publication data) (blue, 22.7 months). C OS of iR (red) and the matching cohort (publication data; black) (P < 0.0001). Statistical significance of survival differences was computed using the log-rank test. 95% confidence interval of cumulative hazard (log survival) is shown as shaded areas. Source data are provided as a Source Data file.
