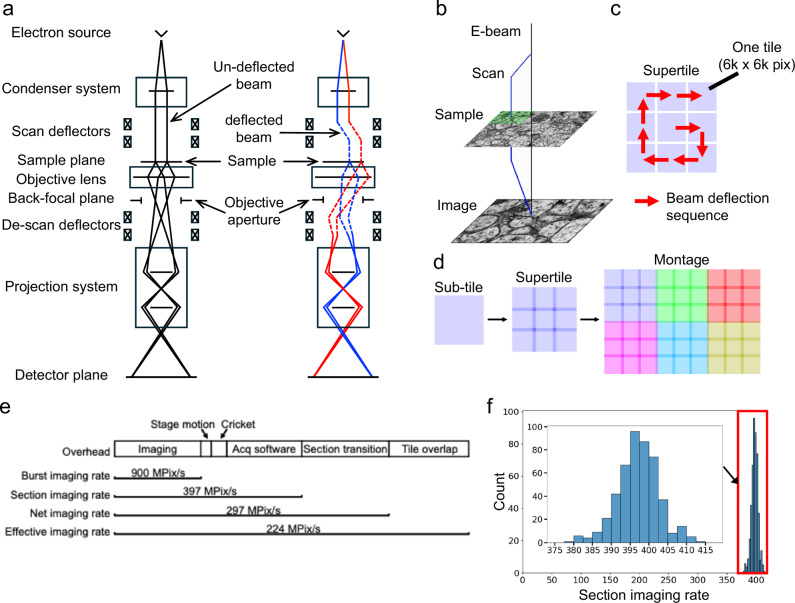
Fig. 1. Beam deflection for TEM imaging.
a Ray diagram describing the optical paths for a central (left) and a singly deflected (right) subtile position in bd-TEM. A pair of rays propagating from different points of a finite electron source are formed into a parallel beam on the sample, and are forward propagated from the sample and formed into a projected and magnified image on the detector (camera) plane. The beam is deflected above the sample to illuminate an adjacent location on the sample, and the subsequent image is returned to the optic axis to be acquired by the camera. b–d Cricket sequentially scans each tile of a 3 × 3 matrix pattern on the sample, producing a “supertile” at a stage position with overlap between tiles. Neighboring supertiles (different colors) can be stitched together to form a montage image. e Imaging speed based on acquisitions at 3 nm/pix (Supplementary Methods). The bar lengths are proportional to the contribution of overheads to imaging speed. Computational overhead of acquisition (“acq software”) includes communications between different components, software time jitters, computing image statistics, and writing image files. Effective imaging rates are calculated from the total number of pixels of a montage acquisition with overlap pixels only counted once (“tile overlap”), over the same overhead as in the net imaging rate. Stage movement and Cricket settling times are determined by the number of tiles and generally remain constant for a specific section (Supplementary Methods). Therefore, the variability in their proportions is determined by the variability in section imaging rate (~1.4% f). f The distribution of section imaging rates for 472 sections. The size of each section is 1.9 × 1.2 mm2. The average rate is 397.1 MPix/s (s.d. 5.5).

