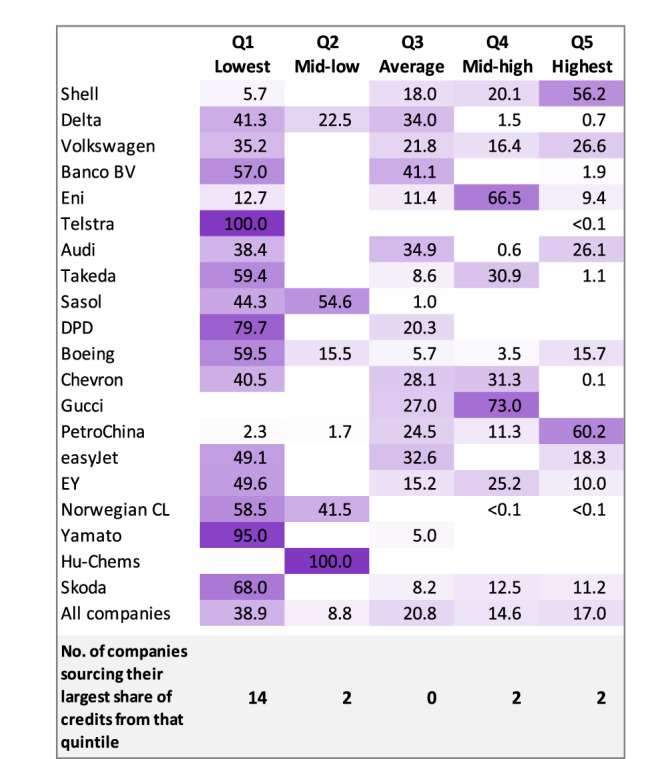
Fig. 4. Share of offset credits retired by price category.

The relative share (%) of credits retired by each company in 2020–2023, is organised into five quintiles. Each reflects the average estimated price of eight types of offset projects contained in our database relative to the price of other offset types (see Table S5). The bottom row shows the number of companies for whom a plurality of offsets (i.e. largest share) falls into that quintile. Pricing estimates for each project type are sourced from Ecosystem Marketplace76. To capture price fluctuations, we coded price categories each year. The table shows aggregated results for yearly trends, compiled in Fig. S4.
