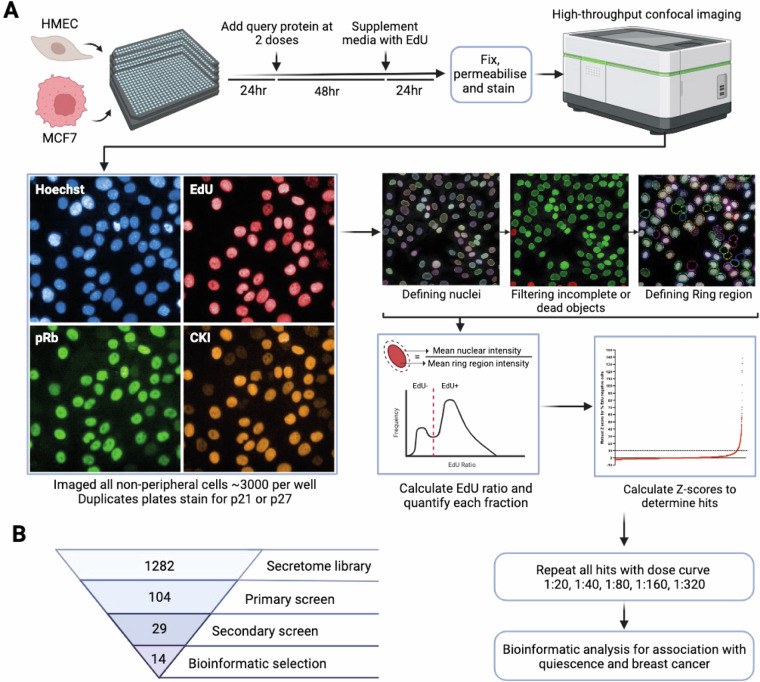
Fig. 1.
Experimental workflow. (a) The screen methodology is depicted starting with the primary screen, including staining, imaging, analysis and hit ranking, followed by a secondary screen of hits and bioinformatic shortlisting. Representative images of each stain are depicted, with CKI (CDK inhibitors) representing p21 or p27. The image analysis pipeline is represented by screenshots from Harmony (PerkinElmer) software. (b) Flow chart depicting how the secretome library was refined at each stage to a final list of proteins which induce G0 arrest.

