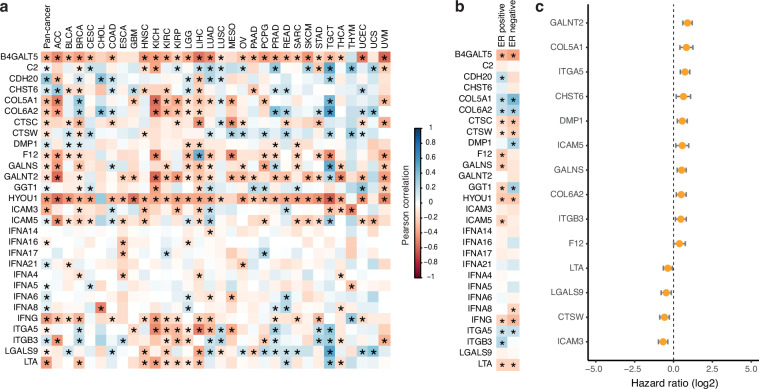
Fig. 2.
Bioinformatic analyses of hits. (a) Correlations between the G0 arrest score per tumour and the expression of selected secretome genes (encoding proteins that were hits in the screen) within the same tumour, calculated pan-cancer (first column) or by cancer type. Abbreviations correspond to different cancer types as defined by TCGA. Positive values (blue) indicate a positive correlation between G0 arrest levels and the expression of the respective gene, negative values (red) indicate an inverse relationship. Significant correlations (Pearson p < 0.05) are marked with an asterisk. (b) Correlations between the G0 arrest score and the expression of selected secretome genes across ER positive and ER negative breast cancers. Colour gradient and asterisk annotations as in (a). (c) Secretome genes with prognostic value in TCGA. The results from Cox proportional hazards analyses for overall survival across all cancers are shown, after adjustment for cancer type and stage. Samples with gene expression in the upper quartile were compared with those whose expression is in the lower quartile for the same gene. Positive values indicate that cases with high expression of the respective gene present worse survival.

