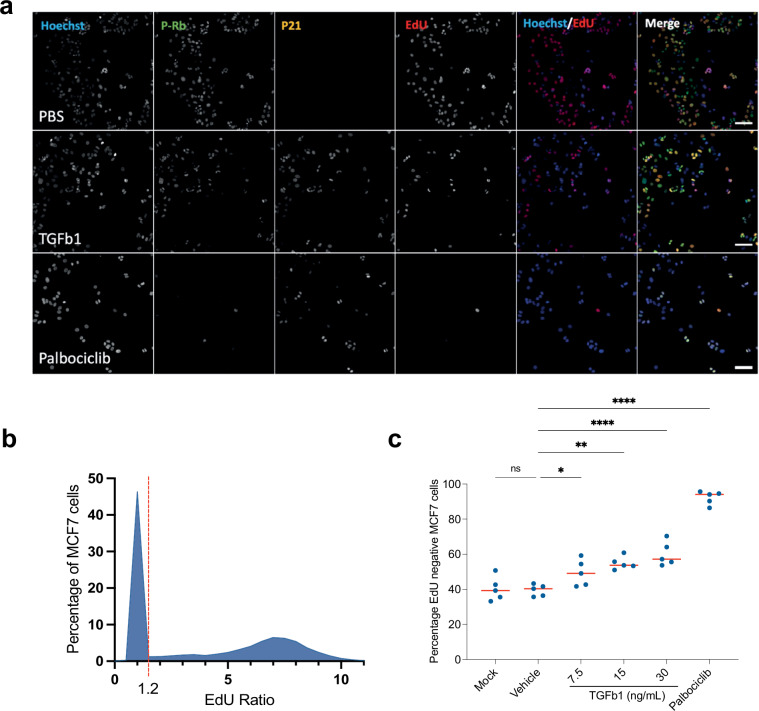
Fig. 4.
Positive controls for the screen that increase G0 arrest. (a) Representative images of screening controls in MCF7 cells - neutral (PBS), and positive controls for G0 arrest - TGFb1 and Palbociclib. In merged images Hoechst is shown in blue, P-Rb in green, p21 in yellow and EdU staining in red. Scale bar = 50 μM. (b) Frequency distribution of single cell data showing the EdU ratio. Dashed red line represents the cut off between EdU negative (−) and EdU positive cells. (c) Quantification of EdU negative (G0 arrested) cells. Graphs showing the percentage of cells per well which are EdU-. Red line represents mean. Mock = PBS treatment and Vehicle = DMSO. One-way ANOVA was used for statistical significance. ****p < 0.0001, ***p < 0.001, **p < 0.01, *p < 0.05, ns = not significant.

