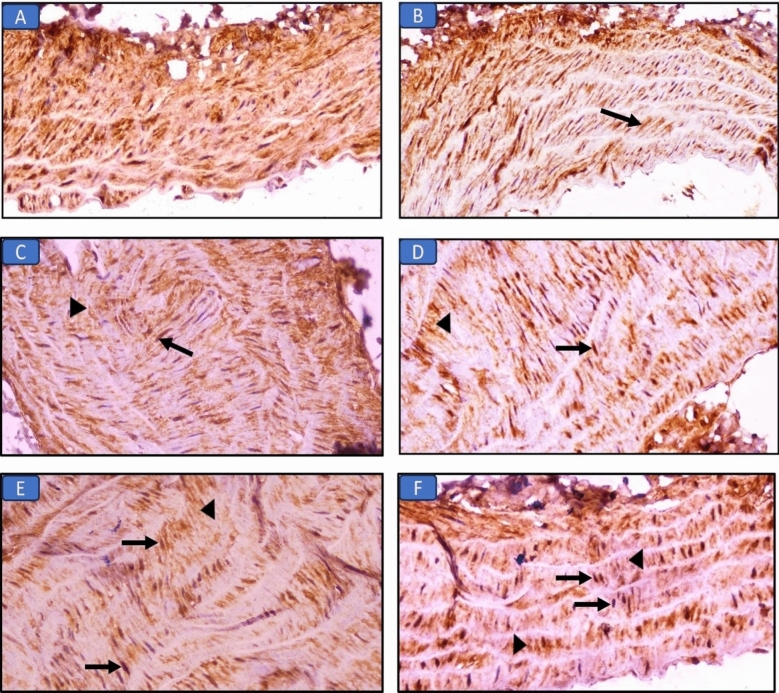
Figure 6.
Immuno-expression of Nrf2 in aorta sections in the different groups: (A) Control group, the aorta shows marked cytoplasmic expression in muscle layer (×400). (B) Long chain saturated fat diet group, the aorta shows moderate cytoplasmic expression in tunica media (arrow) (×400). (C) Long chain monounsaturated fat diet group, the aorta shows moderate nuclear (arrow) and mild cytoplasmic (arrowhead) expression in tunica media (×400). (D) Long chain polyunsaturated fat diet group, the aorta shows marked nuclear (arrow) and mild cytoplasmic (arrowhead) expression in tunica media (×400). (E) Medium chain fat diet group, the aorta shows mild nuclear (arrows) and cytoplasmic (arrowhead) expression in muscle layer (×400). (F) Short chain fat diet group, the aorta shows moderate nuclear (arrows) and mild cytoplasmic (arrowheads) expression in tunica media (×400).

