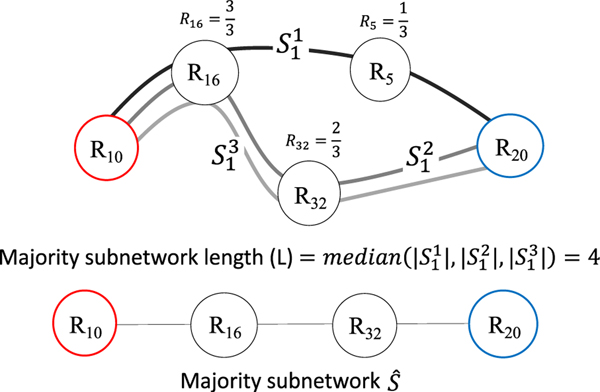
Fig. 4.
Example that illustrates how we estimate the majority subnetwork. Given a small dataset of participants for subnetwork that begins at ROI 10 (red) and ends at brain ROI 20 (blue), the majority subnetwork path length is found where is the number of ROIs (including start and end). Next, the remaining intermediate ROIs that have the greatest occurrence are identified, e.g. ROI 32 is in two of the three subnetworks so the occurrence value is 2/3. The top intermediate brain region occurrence values are thus selected and then combined with the begin and end ROIs to form the majority subnetwork . Note: R is short for ROI in the above illustration.

