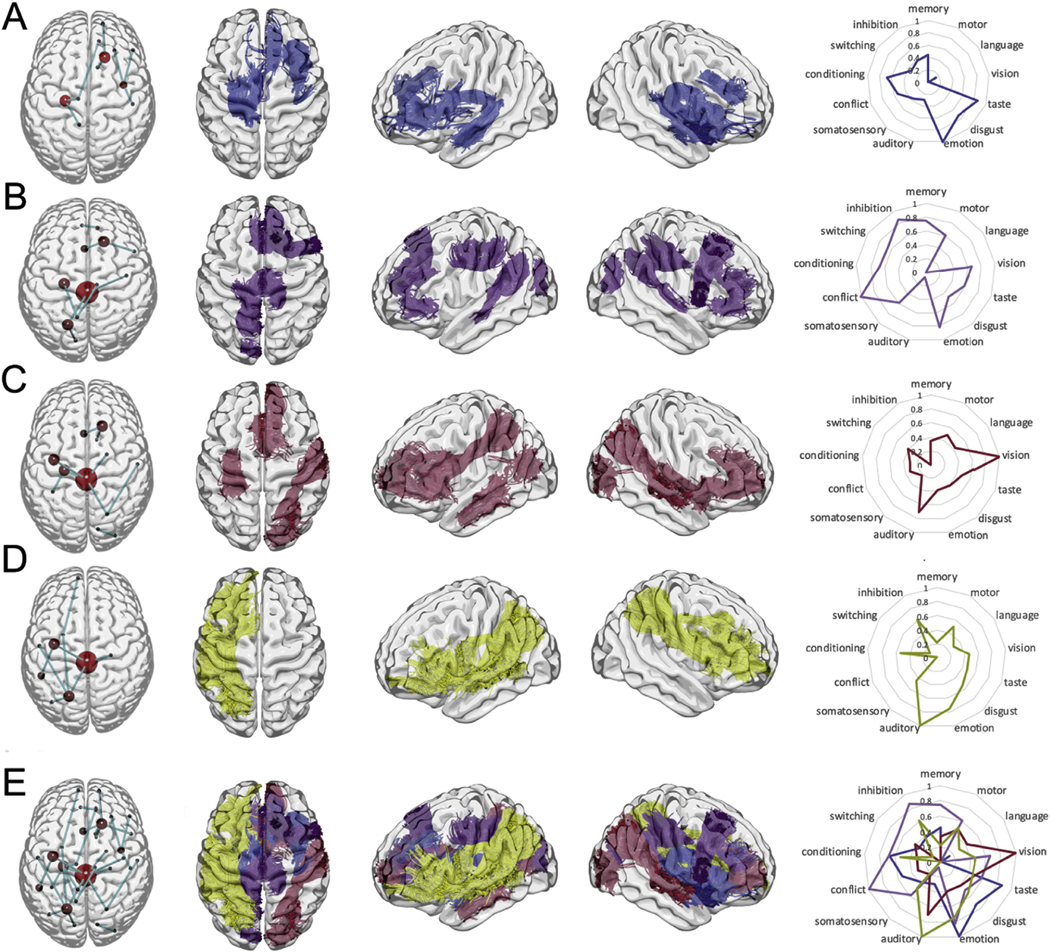
Fig. 8.

Individual subnetworks formed by the top (A) 1-to-4, (B) 5-to-8, (C) 9-to-12, and (D) 13-to-16 majority subnetworks, shown grouped together in (E). The first columns demonstrate the schematic location of brain regions and connections, whereas columns 2 to 4 demonstrates the locations of white matter tracts representing the same connections. For clarity, the connections to the brain stem are not included in columns 2 to 4. The right-most column demonstrates functional loadings to the nodes in each subnetwork based on reverse inference maps from a large database of functional imaging studies included in Neurosynth (Yarkoni et al., 2011). Note: brain regions are represented by red nodes and the size of the node is the related to the number of times the brain region is present in one, or more, majority subnetworks.
