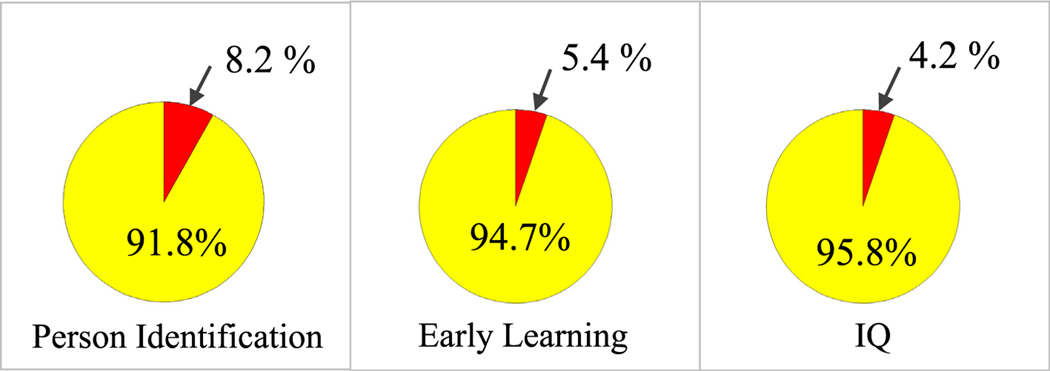
Fig. 9.
Total white matter (WM) connectivity percentages. The “red” shows the percent WM described by the personalized fingerprint when applied to the following connectome datasets: person identification, early learning, and IQ. The “yellow” is the total ROI-to-ROI WM percentage minus the WM fingerprint percentage.

