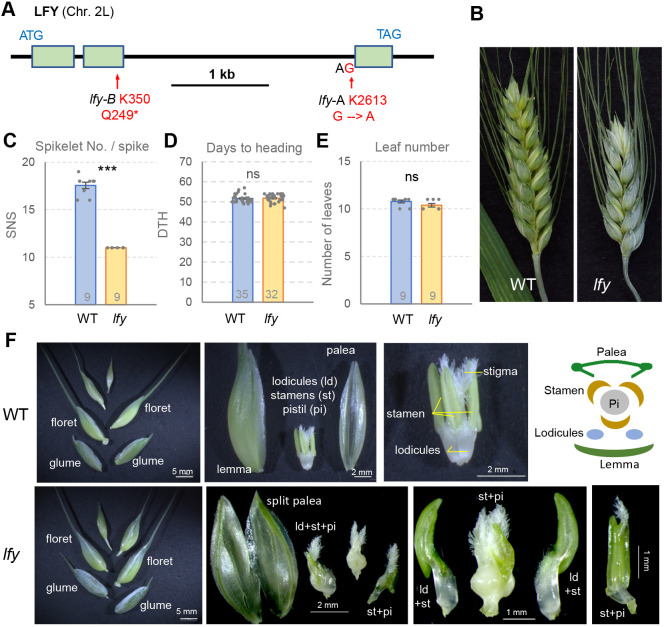
Fig. 1.
Characterization of LFY loss-of-function mutants. (A) LFY gene structure and selected mutations. (B) Representative spikes of wild-type (WT) and lfy mutant plants. (C-E) Comparison between WT and lfy for spikelet number per spike (C), days to heading (D) and leaf number (E). Numbers inside bars indicate biological replicates. Dots represent individual plants; error bars represent s.e.m. ***P<0.001. ns, not significant (two-tailed t-tests). (F) Top: Images of WT spikelets and schema representing the internal structure. Bottom: Floral abnormalities in lfy. ld, lodicule; pi, pistil; st, stamen. See Table S2 for raw data.

