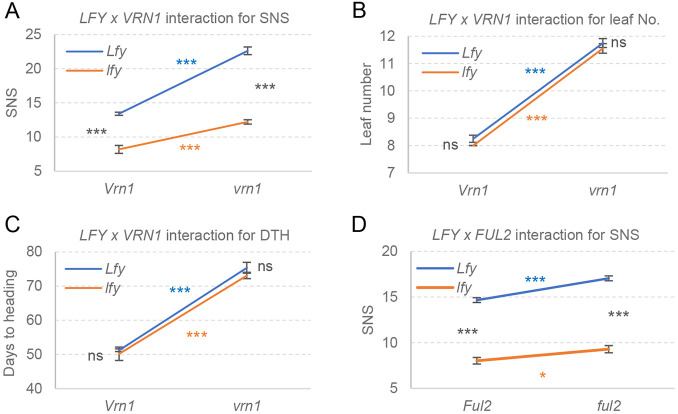
Fig. 6.
Genetic interactions between LFY and the SQUAMOSA MADS-box genes VRN1 and FUL2. (A-C) Interaction graphs between LFY and VRN1 for SNS (total n=34) (A), leaf number (total n=34) (B) and days to heading (DTH) (total n=34) (C). (D) Interaction between LFY and FUL2 for SNS (total n=54). In the interaction graphs, parallel lines indicate additive effects and non-parallel lines reflect interactions. 2×2 factorial ANOVA with P-values indicating the four simple effects (Table S12). *P<0.05, **P<0.01, ***P<0.001. ns, not significant. Error bars are s.e.m. See Table S12 for raw data.

