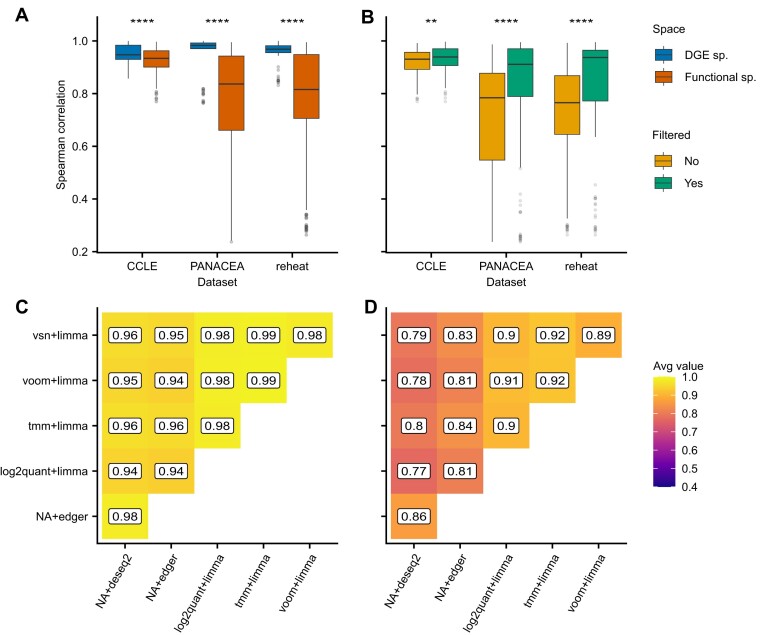
Figure 2.
(A) Average Spearman rank correlation values across pipeline pairs, per dataset, for both DE and Functional spaces. (B) Average Spearman rank correlation values between filtered or unfiltered pipelines versus the rest, per dataset. (C) Average Spearman correlation values between filtered pipelines. (D) Average similarity scores between filtered pipelines. Statistical analysis was performed via one-tailed Wilcoxon tests for the indicated pairs in panels A and B. P-value equivalence: ns: P > 0.05, *P ⇐ 0.05, **P ⇐ 0.01, ***P ⇐ 0.001, ****P ⇐ 0.0001. Sd stands for standard deviation in correlation values, sp. stands for space.

