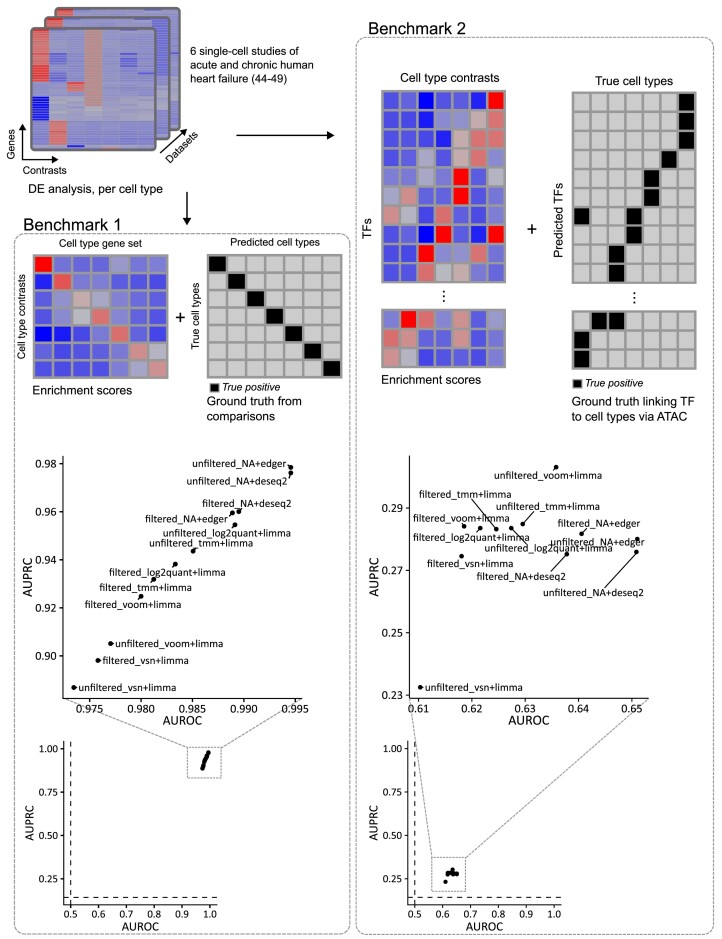
Figure 3.
Evaluation strategies using end-stage heart failure transcriptomic studies (44–49). In the first benchmark (left), DGE data from 7 cell types were enriched in cell-type-specific gene sets and compared against the true cell type used to generate the DGE data. In the second benchmark (right), the cell types were linked to TFs via chromatin accessibility data, and then used as ground truth against TF enrichment scores from DGE data. Below, the scatter plots show AUROC/AUPRC values per pipeline, showing the results of the benchmarks based on end-stage heart failure transcriptomic studies. The left plot shows results using cell-type specific gene sets (Benchmark 1), while the right plot shows results using TF enrichment scores linked to cell types (Benchmark 2). Dashed lines show baseline values for AUROC (0.5) and AUPRC (0.143).

