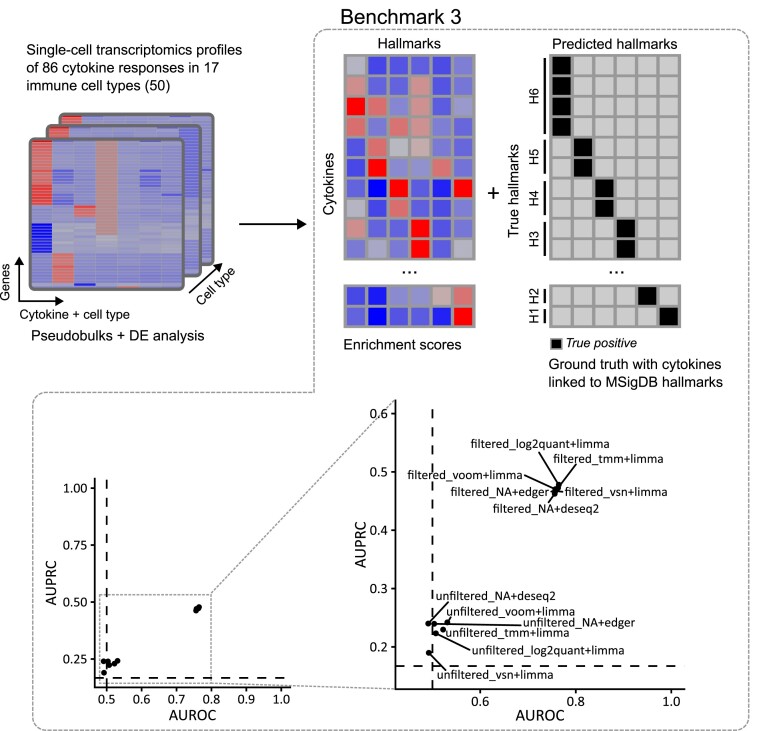
Figure 4.
Evaluation strategy using cytokine-perturbed transcriptomic data for different immune cell types (50). DGE data from 86 cytokine treatments and 17 cell types were enriched in MSigDB hallmarks gene sets. The ground truth was generated by linking cytokines to MSigDB hallmarks and compared against the enrichment scores for the different hallmarks. AUROC and AUPRC scores per pipeline were computed. Dashed lines show baseline values for AUROC (0.5) and AUPRC (0.167).

