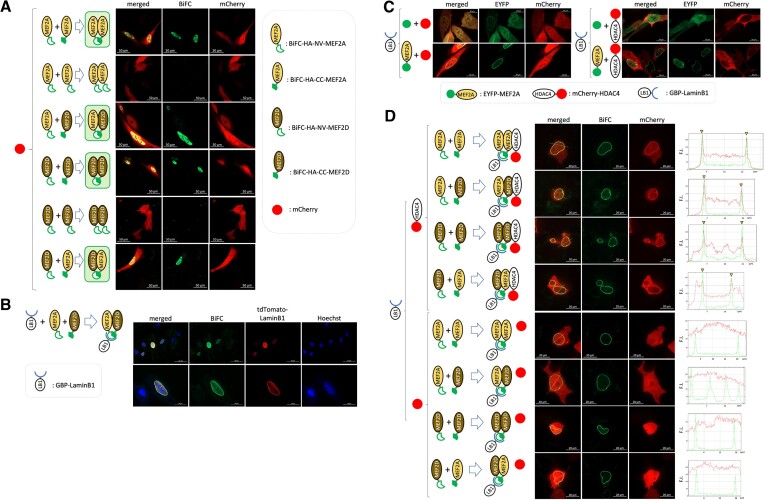
Figure 2.
Visualization of a specific dimer pairing by BiFC technique and 3-way PPI using BiFC and GBP-nanotrap techniques. (A) C2C12 cells were transfected with a combination of indicated expression constructs in the left side panel. mCherry was included for monitoring transfection. Transfected cells were subjected to live cell imaging by confocal fluorescence microscopy. BiFC signal (green) generation due to complementation and mCherry (red) were depicted in represented micrographs. (B) HEK293T cells were transfected with GBP-LaminB1 (GBP-LB1), BiFC-NV-HA-MEF2A, and BiFC-CC-HA-MEF2D. Transfected cells were subjected to live cell imaging by confocal fluorescence microscopy technique. The nuclei (blue) were stained with Hoechst 33342. (C) C2C12 cells were transfected with a combination of the indicated expression constructs in the left side panel. Expression of EYFP or EYFP-MEF2A (green) and mCherry or mCherry-HDAC4 (red) was visualized by live cell confocal fluorescence microscopy. (D) C2C12 cells were transfected with a combination of the indicated expression constructs in the left side panel. Generation of BiFC signal (green) due to complementation of BiFC tags indicates a specific MEF2 dimer formation. Co-localization of BiFC signal and mCherry-HDAC4 but not mCherry was depicted by line scan analysis of the intensity of the fluorescence signal along the yellow line in the merged micrographs. Signal intensity peak matches are indicated by yellow triangle.

