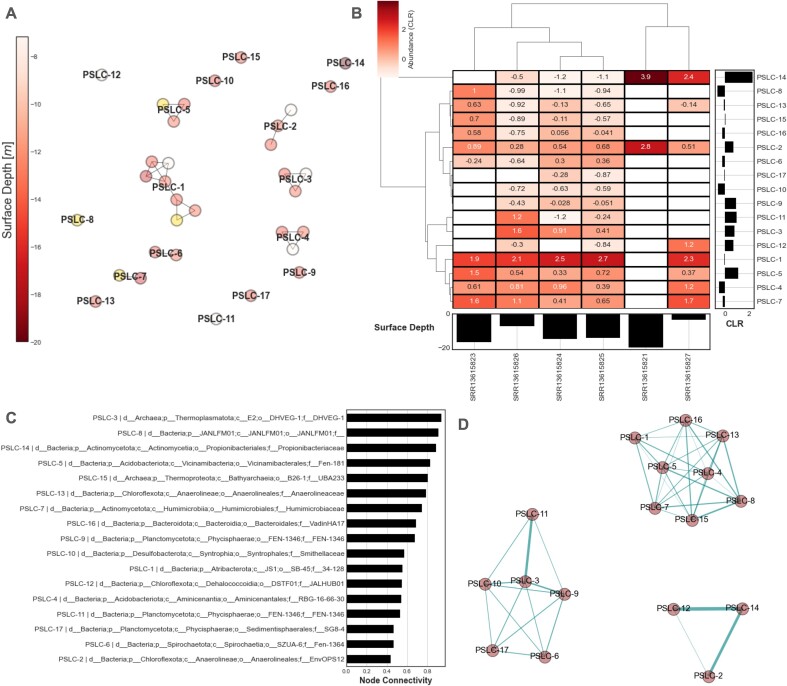
Figure 3.
Pangenome analysis of permafrost prokaryotes. (A) Constellation plot of prokaryotic SLCs (yellow indicates multi-sample MAG). (B) Clustermap of transformed SLC abundances with Aitchison distance for samples and pairwise variance log-ratio for SLCs. (C) Graph of Leiden community detection for positive associations calculated from partial correlation with basis shrinkage. (D) Weighted degree shown as node connectivity of Leiden graph.

