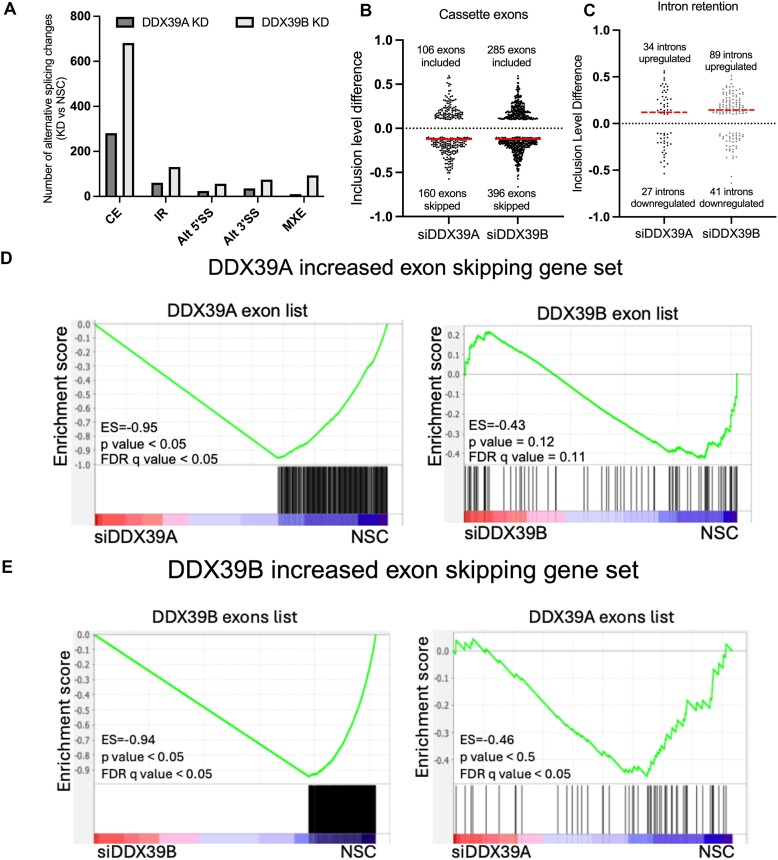
Figure 3.
Changes in RNA alternative splicing upon DDX39A and DDX39B depletion: (A) number of alternative splicing events that are significantly different (P< 0.05 and |inclusion level difference| > 0.1) between DDX39A or DDX39B knockdown as compared to control (NSC) (CE: cassette exon splicing; IR: intron retention; Alt3’SS: alternative 3′splice site; Alt5’SS: alternative 5′SS; MXE: mutually exclusive exons). (B) Inclusion level differences of exons that are differentially spliced upon DDX39A and DDX39B knockdown. A positive inclusion level difference indicates exons that are included more upon knockdown, and a negative inclusion level difference indicates exons that are skipped more (included less) upon knockdown. (C) Inclusion level differences of introns differentially spliced upon DDX39A and DDX39B knockdown. A positive inclusion level difference indicates introns that are retained (included more) upon knockdown, and a negative inclusion level difference indicates introns that are spliced (included less) more upon knockdown. The red line indicates the median inclusion level difference. (D) GSEA results of enrichment of exons skipped more upon DDX39A knockdown in NSC control compared to DDX39A knockdown (left panel) and DDX39B knockdown (right panel). (E) GSEA results for enrichment of exons skipped more upon DDX39B knockdown in controls compared to DDX39B knockdown (left panel) and DDX39A knockdown (right panel).

