Figure 6.
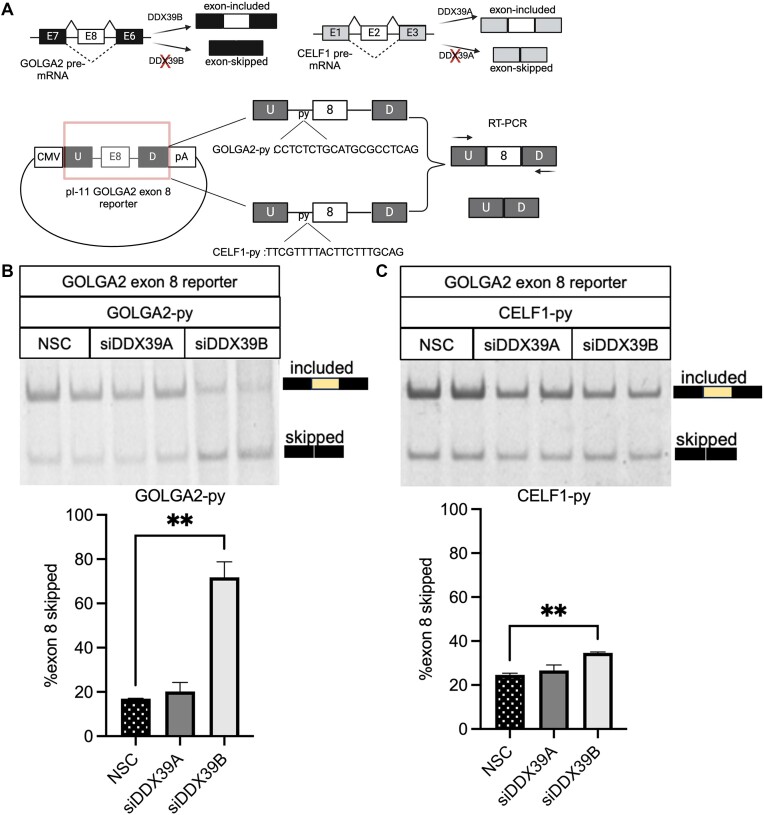
U-poor py tract of GOLGA2 exon 8 dictates its dependency on DDX39B expression. (A) Top panel shows the change in alternative splicing of GOLGA2 exon 8 and CELF1 exon 2 upon DDX39B and DDX39A depletion, respectively. (Bottom panel) Construction of GOLGA2 exon 8 reporters with wild-type GOLGA2 intron 7 py tract and CELF1 intron 1 py tract. RT-PCR analysis of GOLGA2 exon 8 reporters splicing changes with (B) wild-type GOLGA2 intron 7 and (C) CELF1intron 1 py tracts in DDX39A (siD09) and DDX39B (siD13) knockdown and control cells. The top panel shows the RT-PCR amplicons on 6% TBE gels and the bottom panel shows the bar graphs depicting the percent exon 8 skipping based on quantification of these gels. Statistical significance was calculated using the Student's t test (**P ≤ 0.01)

