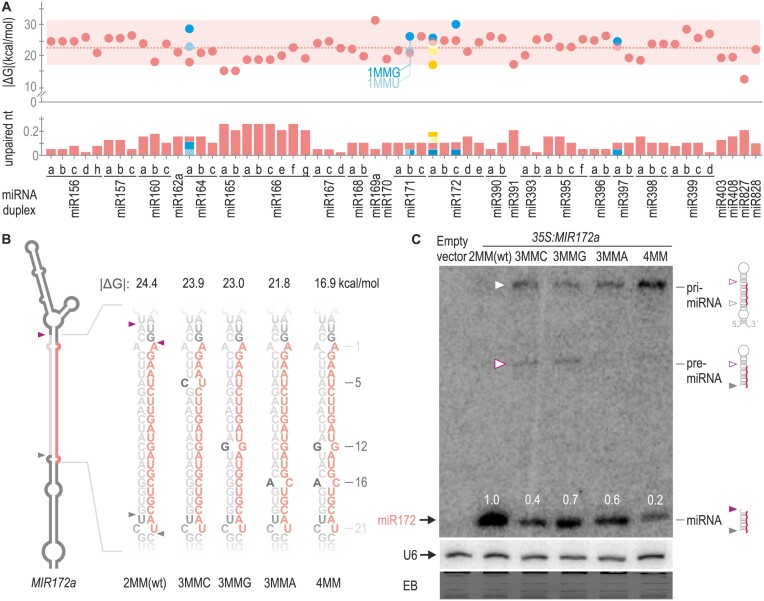
Figure 2.
Quantitative regulation of MIRNA processing efficiency by the miRNA/miRNA* secondary structure. (A) Dot plot representing the |ΔG| of 62 miRNA duplexes from two-step MIRNAs shown as red dots. A dotted red line shows the mean |ΔG|. A red box encloses 95% of the duplexes which have an interacting energy between ∼17 and 31 kcal/mol. Unpaired nt frequency is shown as red bars on the bottom panel. Blue and yellow dots and bars indicate modifications in the |ΔG| and unpaired nt frequency of miRNAs duplex from Figures 1 and 2B, respectively. (B) Schematic representation of MIR172a, the sequence of the wt and mutant miRNA duplexes is shown to the right. These depictions are based on mfold secondary structure prediction (see Appendix II). Black letters specify the introduced mismatches, and the numbers indicate their position counting from the 5′end of the miRNA. MiRNA is shown in red and miRNA* in grey. |ΔG| of the duplex are shown above each small RNA sequence. (C) Small RNA blot for miR172 transgenic lines expressing different precursors from the 35S promoter. Each sample corresponds to 15 pooled 10-day-old seedlings from independent primary transgenic plants. Numbers above small RNA blots correspond to miRNA levels quantified relative to the wt precursor. Schematic representation of the detected MIR172 processing intermediates is shown on the right. A grey empty arrow and purple empty arrow indicate the pri-miRNA and pre-miRNA detected in the blot, respectively. Both U6 hybridization and EB staining are shown at the bottom.

