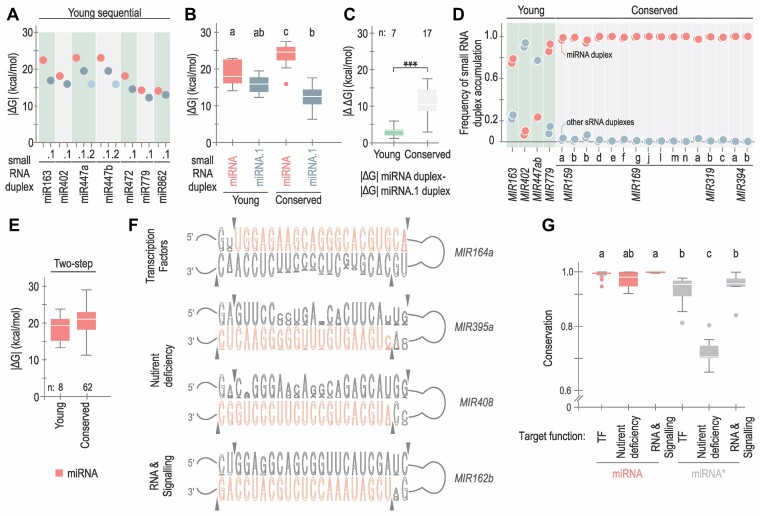
Figure 6.
Conservation and divergence of small RNA duplexes. (A) Dot plot representing |ΔG| calculated for each small RNA duplex derived from evolutionary young sequentially processed MIRNAs. Duplexes are shown in red (miRNA/miRNA*), dark grey (miRNA.1/miRNA.1*) and light blue (miRNA.2/miRNA.2*). (B) Box plots representing |ΔG| values of miRNA (red) and miRNA.1 (dark grey) duplexes from conserved and young sequential MIRNAs. Different letters indicate statistically significant differences, according to ANOVA (P-value < 0.0001) followed by Tukey's multiple comparison test (P < 0.05). (C) Box plots representing differential interacting energy (|ΔΔG|) between the miRNA/miRNA* and the miRNA.1/miRNA.1* from each evolutionarily young (green) or conserved (light grey) sequential MIRNA. Asterisks indicate statistically significant differences according to Wilcoxon signed-rank test (two-sided), P < 0.001 (***). (D) Frequency of small RNA duplex accumulation. The colour is described in (A). (E) Box plots representing |ΔG| of miRNA duplexes from evolutionary young (left) and conserved (right) MIRNAs processed with two DCL1 cuts, no statistically significant differences were observed. See Supplementary Table S4 for all statistical tests performed. (F) Conservation of the miRNA/miRNA* region of MIR164a, MIR395a, MIR408 and MIR162b region. Sequence logos were generated using WebLogo (v 3.7.12). Arrows indicate the sites of DCL1 cuts. (G) Box plot showing the conservation of miRNA (red) and miRNA* (grey) using phastCons (v 1.5) for miRNA and miRNA* sequences according to the function of the miRNA’s targets: transcription factors (TF, 25 miRNAs, 651 orthologues), nutrient deficiency (nine miRNAs, 221 orthologues) and RNA metabolism and hormone signalling (RNA & Signalling, six miRNAs, 155 orthologues). Different letters indicate statistically significant differences (Kruskal–Wallis multiple comparison test, P-value < 0.05).

