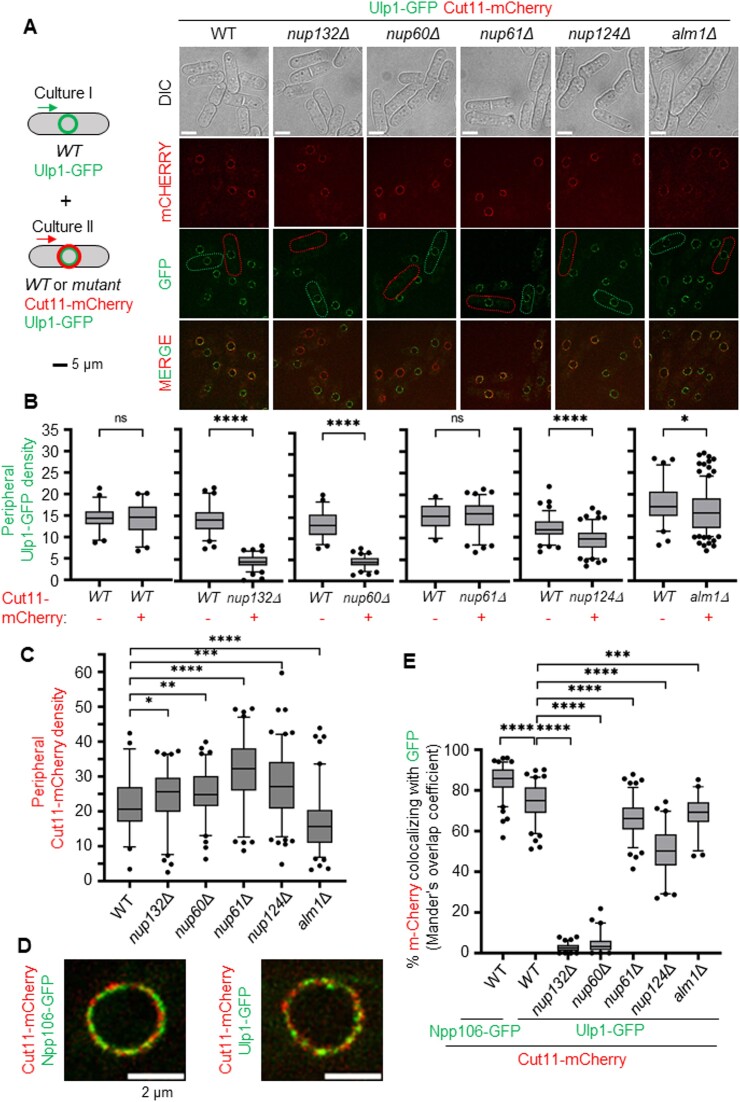
Figure 4.
The nuclear basket contributes to sequester the SUMO SENP protease Ulp1 at the nuclear periphery. (A) Left panel: scheme of the strategy employed by equally mixing two genetically distinct cell cultures. Right panel: representative cell images of Cut11-mCherry and Ulp1-GFP in indicated strains. Green and red cell borders indicate cells from culture I (expressing Ulp1-GFP) and culture II (expressing Ulp1-GFP Cut11-mCherry), respectively. Scale bar 5 μm. (B) Box-and-whisker plots of Ulp1-GFP density (mean fluorescence intensity) at the nuclear periphery in indicated strains and conditions. Boxes represent the 25/75 percentile, black lines indicate the median, the whiskers indicate the 5/95 percentile and dots correspond to minimum and maximum values. P value was calculated by Mann–Whitney U test (**** P ≤ 0.0001; *** P ≤ 0.001; ** P ≤ 0.01; * P ≤ 0.05; ns: non-significant). At least 50 nuclei were analyzed for each strain. (C) Box-and-whisker plots of Cut11-mCherry density (mean fluorescence intensity) at the nuclear periphery in indicated strains. Boxes represent the 25/75 percentile, black lines indicate the median, the whiskers indicate the 5/95 percentile and dots correspond to minimum and maximum values. P value was calculated by Mann–Whitney U test (**** P ≤ 0.0001; *** P ≤ 0.001; ** P ≤ 0.01; * P ≤ 0.05; ns: non-significant). At least 50 nuclei were analyzed for each strain. (D) Example of the localization of Npp106-GFP and Cut11-mCherry (left panel) or Ulp1-GFP and Cut11-mCherry (right panel) on overlay images. Scale bar: 2 μm. (E) Box-and-whisker plots of co-localization between Cut11-mCherry and Ulp1-GFP (Mander's overlap coefficient) in indicated strains. The co-localization between the Npp106-GFP, an inner ring nucleoporin of NPC, and Cut11-mCherry, was performed as a control to show maximum correlation between intensities of those both proteins at the resolution achieved on the images. Boxes represent the 25/75 percentile, black lines indicate the median, the whiskers indicate the 5/95 percentile and dots correspond to minimum and maximum values. P value was calculated by Mann–Whitney U test (**** P ≤ 0.0001; *** P ≤ 0.001)

