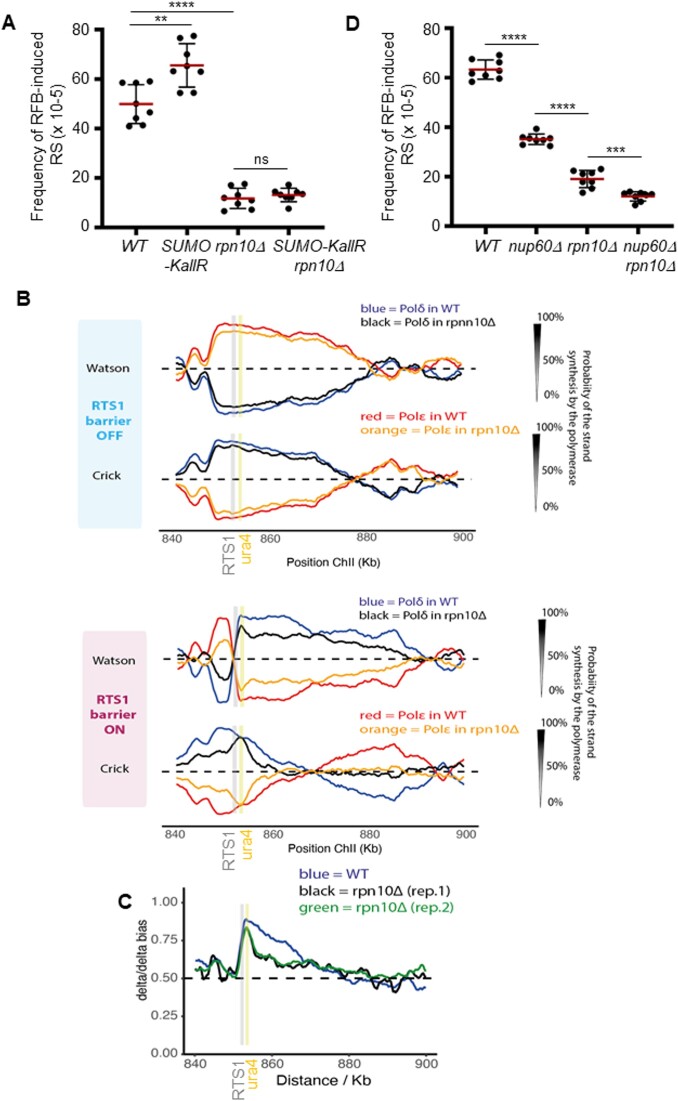
Figure 6.
Proteasome-associated NPCs promote the progression of restarted fork. (A) Frequency of RFB-induced RS in indicated strains and conditions. Dots represent values obtained from independent biological experiments. Red bars indicate mean values ± SD. P value was calculated by two-sided t-test (**** P ≤ 0.0001; *** P ≤ 0.001, ** P ≤ 0.01; ns: non-significant). (B) Pu-Seq traces of the ChrII locus in RTS1-RFB OFF (top panel) and ON (bottom panel) conditions in WT and rpn10Δ strains. The usage of Pol delta (in blue and black for WT and rpn10Δ cells, respectively) are shown on the Watson and Crick strands. The usage of Pol epsilon (in red and orange for WT and rpn10Δ cells, respectively) are shown on the Watson and Crick strands. Note that the switch from Pol epsilon to Pol delta on the Watson strand at the RFB site (gray bar) is indicative of a change in polymerase usage on the leading strand in RFB ON condition. The genomic location of the ARS, the RTS1-RFB and the ura4 marker are indicated by dashed lines, a gray line and a yellow line, respectively. (C) Graph of Pol delta/delta bias in RFB ON condition according to chromosome coordinates in WT and two independent replicates of rpn10Δ strains. The gray and yellow bars indicate the position of the RTS1-RFB and of the ura4 marker, respectively. (D) Frequency of RFB-induced RS in indicated strains and conditions. Dots represent values obtained from independent biological experiments. Red bars indicate mean values ± SD. P value was calculated by two-sided t-test (**** P ≤ 0.0001; *** P ≤ 0.001).

