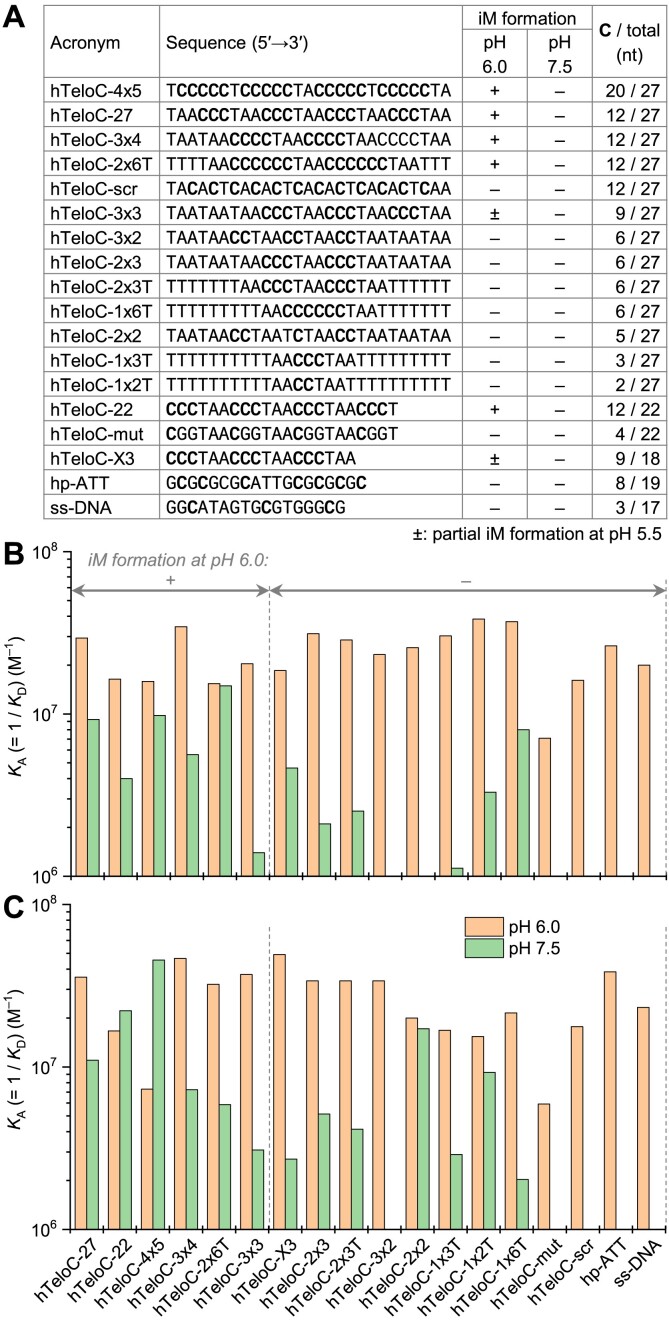
Figure 3.
(A) Oligonucleotides used in BLI experiments and their capacity to adopt iM structures, as inferred from CD spectra (Supplementary Figure S12). (B, C) Comparison of KA (= 1/KD) values for binding of iMab scFv-His6 (B) and scFv-His6-FLAG (C) to the oligonucleotides listed in panel (A), at pH 6.0 (orange) and 7.5 (green bars). Data are mean values from two independent experiments (for individual values, cf. Supplementary Table S1).

