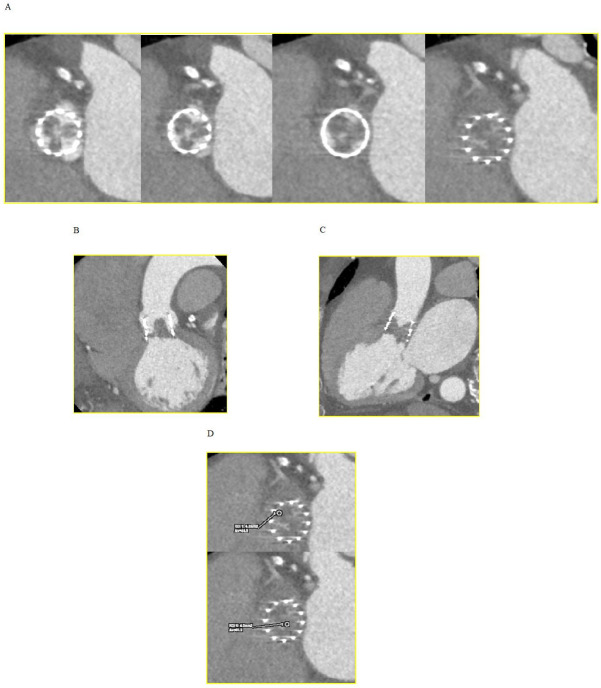
Fig. 2.
Hypoattenuated lesions at CT. (A) Short axis view of the transcatheter heart valve showing thickened and hypoattenuating leaflets. (B) Coronal oblique view. (C) Sagittal oblique view. (D) CT attenuation levels lower than those observed within the myocardium (90 HU) suggesting a thrombus. CT, computed tomography; HU, hounsfield units.

