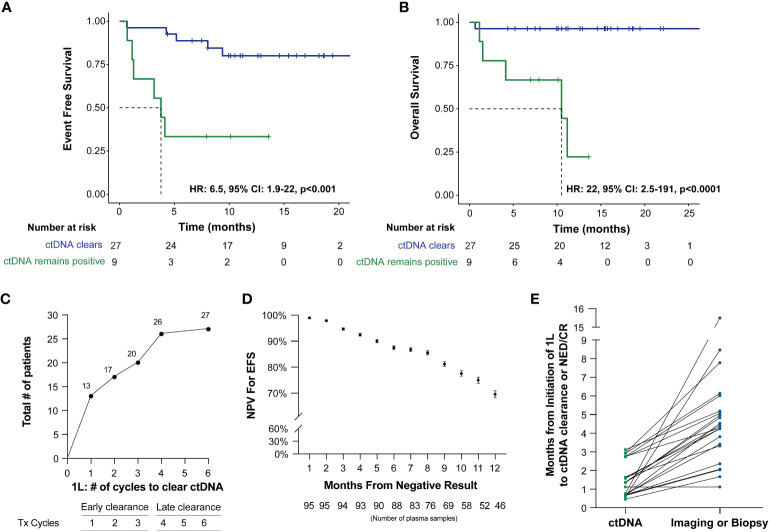
Figure 3.
Kaplan-Meier estimates of patients with DLBCL representing ctDNA clearance stratified by (A) EFS and (B) OS. For this analysis, a landmark was implemented (to account for the potential time bias) 3 weeks after first-line therapy (after cycle 1) to evaluate the association of ctDNA with EFS and OS. (C) ctDNA dynamics among patients during the six cycles of 1L therapy. (D) NPV for EFS post-1L therapy negative ctDNA result, with NPV >90% for recurrence/death for patients with a negative result within the first 5 months. (E) Time of ctDNA clearance vs imaging or biopsy result of NED/CR relative to initiation of 1st line therapy.

