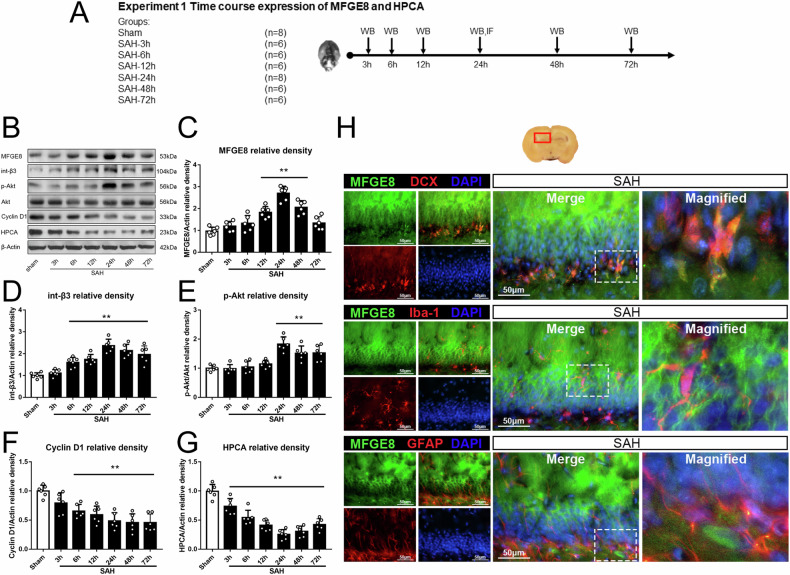
Fig. 2. Temporal expression of endogenous MFGE8 and HPCA, and cellular localization of MFGE8 after SAH.
A Experimental design, animal groups and time frame of the analyses in experiment 1. B Representative bands and (C–G). quantitative analyses of endogenous MFGE8 integrin β3, p-Akt, Akt, cyclin D1 and HPCA in left hippocampus after SAH. The MGFE8, integrin β3 and p-Akt are increased and peaked at 24 h after SAH, while cyclin D1 and HPCA show the opposite trend. **P < 0.01 vs sham group. Error bars were represented as mean ± SD. One-way ANOVA, Tukey’s test, n = 6 per group. H Double immunofluorescence staining of MFGE8 (green) with DCX (immature neuron marker, red), Iba-1(microglia marker, red) and GFAP (astrocytes marker, red) in hippocampus at 24 hr after SAH. Red box indicated the hippocampus in the brain slice. n = 2 per group. Scale bar, 50 μm. DCX doublecortin, Iba-1 ionized calcium binding adapter molecule-1, GFAP glial fibrillary acidic protein, DAPI diamidino phenylindole.

