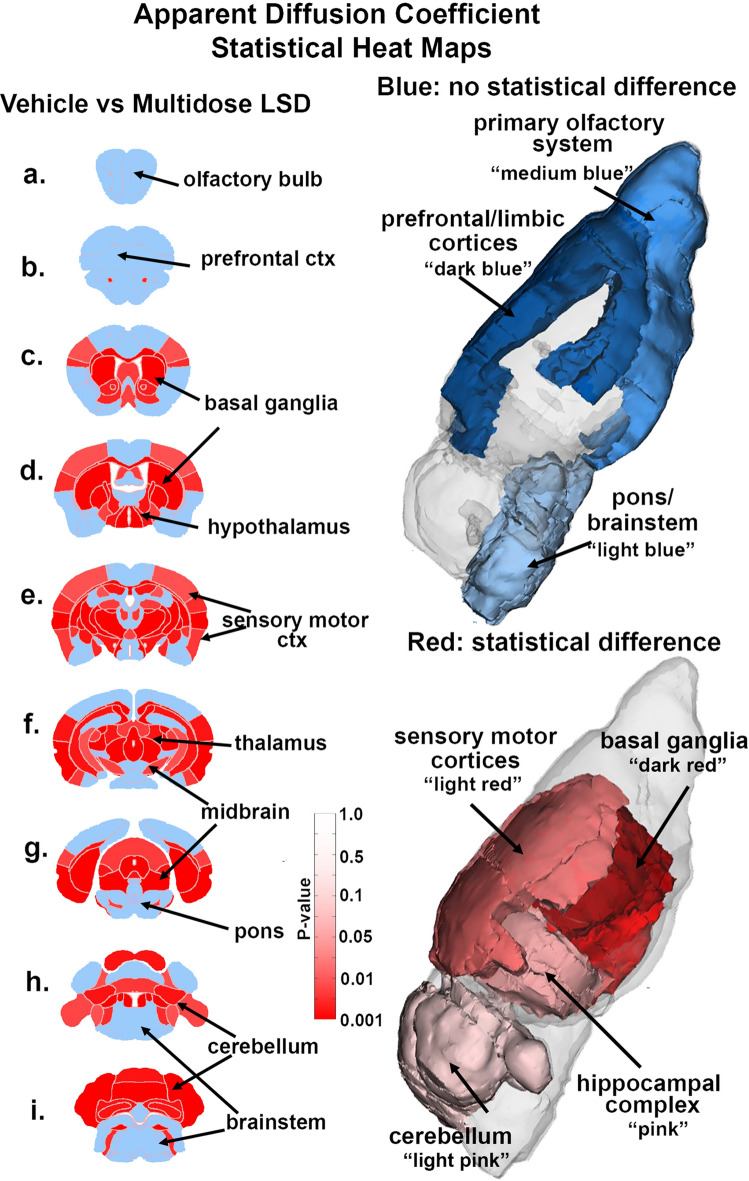
Figure 2.
Apparent diffusion coefficient. Shown are 2D images of statistical heat maps showing the location of brain regions that were significantly different in ADC values between multidose LSD and vehicle. Areas in red denote a significant increase in ADC values over vehicle for LSD treatment. The blue denotes areas that were unaffected by LSD treatment emphasizing the olfactory bulb, prefrontal cortex and brainstem. The 3D color coded reconstructions to the right summarize these regional difference in measures of ADC.

