Fig. 1.
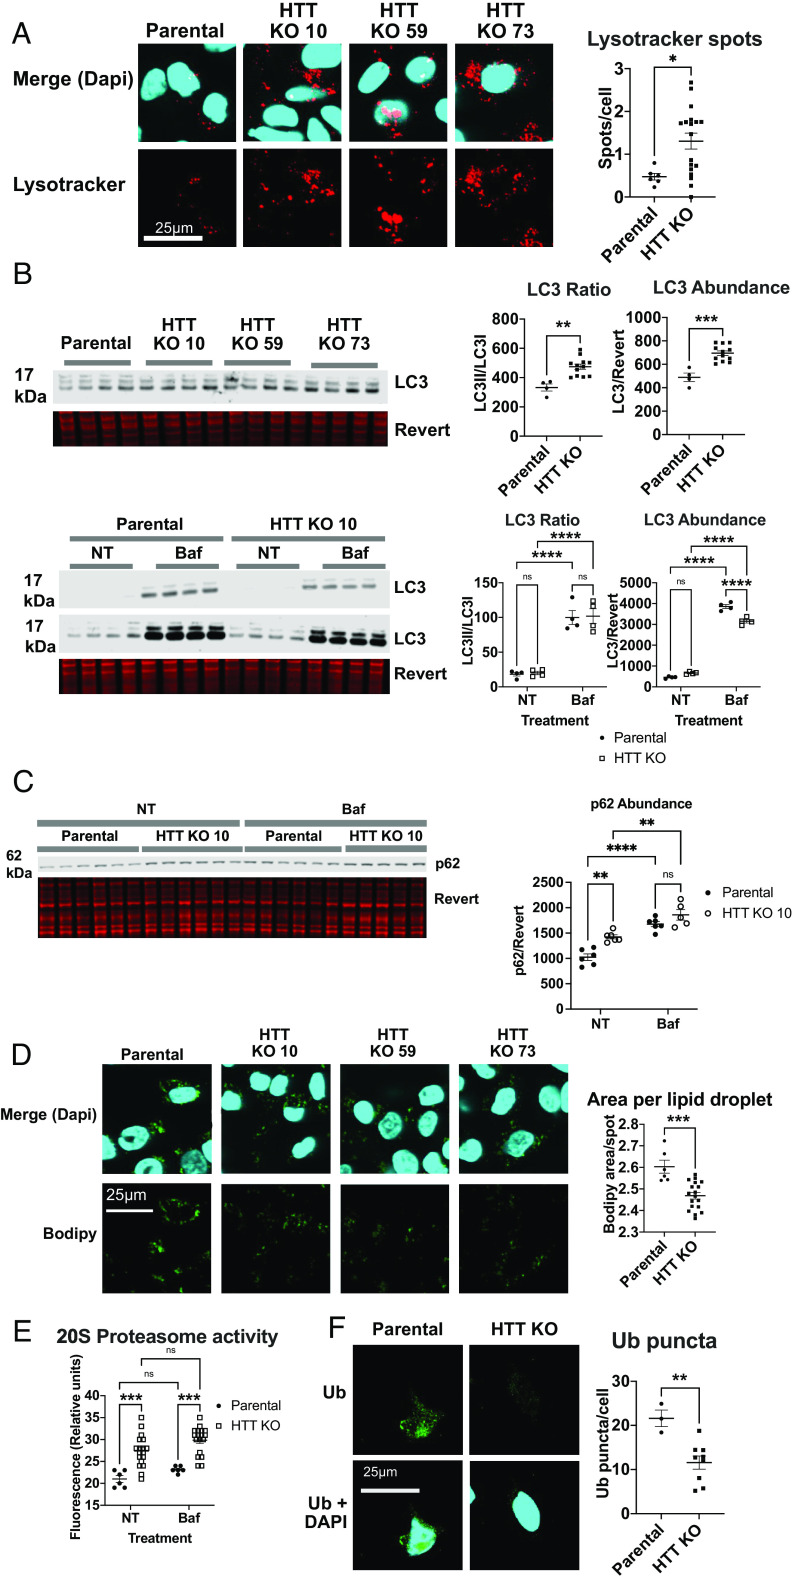
Proteostasis is disrupted in 8988T TMEM192-HA cells by HTT KO. (A) Lysotracker red staining was performed on six wells of parental and HTT KO cell lines, and three images were averaged per well. Spots were quantified using Imaris software and compared using a two-tailed t test. (B) LC3 abundance and ratio of LC3II to LC3I were evaluated by western blot with or without 4 h of 50 nM Baf treatment. Whole protein levels were quantified using revert protein stain from LI-COR Biosciences. (C) Abundance of autophagic receptor p62 was evaluated by western blot with and without Baf treatment. (D) Lipid droplet staining was performed using Bodipy following overnight oleic acid (200 nM) treatment on six wells of each cell line. Three images were averaged per well. For all statistical analyses, three HTT KO cell lines were grouped. (E) 20S proteasome activity was analyzed using a fluorescence-based assay with and without Baf treatment at 50 nM for 4 h using HTT KO clone 10. (F) Ubiquitin puncta were quantified using Imaris software from HTT KO clone 10. Confocal microscopy was used to take three 20× images per well, three wells per cell line. In all statistical analyses, replicates from two or three HTT KO clonal lines were analyzed together as biological replicates.

