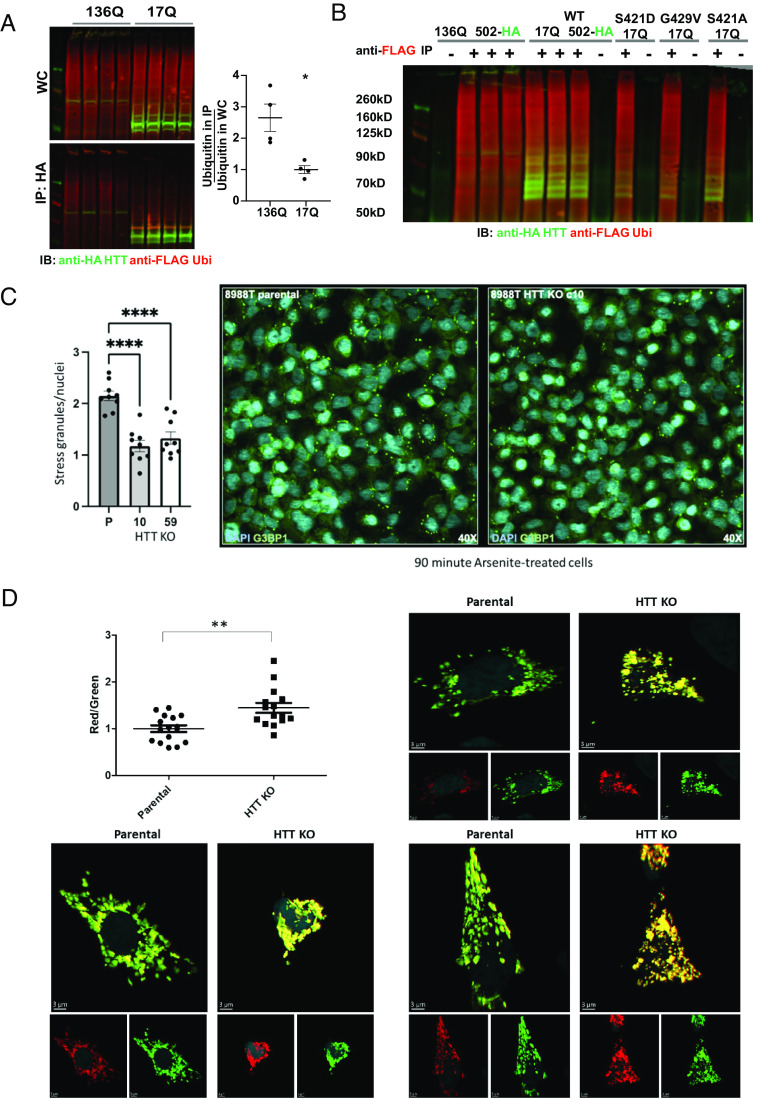
Fig. 5.
Higher levels of ubiquitinated proteins coimmunoprecipitate with mutant HTT fragment compared with wt control, and HTT KO alters RBP-containing stress granule clearance and mitochondrial health. (A) St14A cells were cotransfected with FLAG-ubiquitin and with 17Q-502-HIS-HA-HA-HIS (wt) vs. 136Q-502-HIS-HA-HA-HIS HTT (mutant) fragment. Whole-cell (WC) lysate was used for anti-HA MAB immunoprecipitation. Western analysis demonstrates that ubiquitinated proteins coimmunoprecipitate with wt HTT fragment, and the expansion of the polyQ repeat significantly enhances HTT binding to ubiquitinated proteins. Statistical analysis was done with an unpaired t test (P = 0.0108). (B) FLAG-ubiquitin does not stick nonspecifically to the protein G dynabeads used for immunoprecipitation. Whole-cell lysates of St14A cells expressing FLAG-ubiquitin together with either 136Q- or 17Q- wt, S421D, G429V, or S421A 502 HTT-HIS-HA-HA-HIS fragment were subjected to immunoprecipitation with mouse anti-FLAG antibody (+) or zero (−) antibody control. While FLAG-ubiquitin was easily purified with this anti-FLAG immunoprecipitation, FLAG-ubiquitin did not bind nonspecifically to protein G dynabeads used to capture the antibody. Western immunoblot (IB) was incubated with mouse anti-FLAG and with rabbit anti-HA antibodies for detection. (C) HTT KO reduces the number of arsenite-induced G3BP1-positive stress granules in 8988T TMEM192-HA cells. Cells were treated with acute sodium arsenite stress (125 μm NaAsO2) for 90 min, then fixed and stained with G3BP1 (green) and Hoechst (cyan). For each condition, quantitation of cells with G3BP1-positive stress granules (SGs) and Hoechst markers were captured. SG and nuclei quantification were completed using Cell Profiler. A parameter was created which normalized the SG count to nuclei in a single image to help control for differences in cellular confluency attributed to stressors. Data from the parental (P) and each HTT KO clone (clone 10 and clone 59) were statistically analyzed using a One-Way ANOVA (F(2, 24) = 23.34, P < 0.0001; n = 9, mean SEM; ****P < 0.0001). (D) HTT KO significantly increases the MitoTimer red/green ratio indicative of increased mitochondrial oxidative stress and reduced mitochondrial health. 8988T parental or clone 10 HTT KO cells were transfected with pMitoTimer and images were analyzed by Imaris software using the surface module to measure the sum of green intensity and the sum of red intensity of each cell. Statistical analysis was done by an unpaired t test.

